Outlook Report
Executive Summary
The 2018 August Sea Ice Outlook (SIO) for September ice conditions received 39 (34 in June, 39 in July) contributions, variously based on dynamical (physics-based) models, statistical approaches, heuristic (qualitative), and mixed methods. Along with projections of total Arctic sea ice extent for September, the SIO received 10 (10 in June, 9 in July) projections of Antarctic total ice extent and 11 (11 in both June and July) projections of ice extent in the Alaskan sector (combining the Bering, Chukchi, and Beaufort Seas). Thank you to all the contributors!
The SIO, a product of the Sea Ice Prediction Network–Phase 2 (SIPN2) project, is a platform for the research community to compare seasonal predictions of sea ice conditions based on different techniques. It does not provide operational forecasts. The SIO emphasizes, but is not limited to, predictability of Arctic sea ice extent for September, which represents the end of the summer retreat season. The SIO is open to anyone interested in sea ice and its predictability. Participants whose methods provide spatial information on sea ice conditions are encouraged to provide full spatial fields via the SIPN Data Portal, which enables computation of sea ice probability (SIP) and the first ice-free day (IFD) along with other regional metrics.
The median of the 39 projections for total September 2018 Arctic sea ice extent is 4.6 million square kilometers, with lower and upper quartiles values of 4.3 and 4.9 million square kilometers. These projections are slightly higher and show less spread compared with last year's (2017) August projections that had median, lower, and upper quartile values of 4.5, 4.2, and 4.8 million square kilometers, respectively. In the July 2018 Outlook, the projected September 2018 Arctic sea ice extent was 4.7 million square kilometers with lower and upper quartiles values of 4.4 and 4.9 million square kilometers. The mixed and dynamical models lead to the larger interquartile spread in the August compared to the July predictions of September sea ice extent. Predictions of September extent from statistical and heuristic approaches are generally below the median value observed in 2017, whereas the model-based contributions predict a September extent similar or slightly above last year's value.
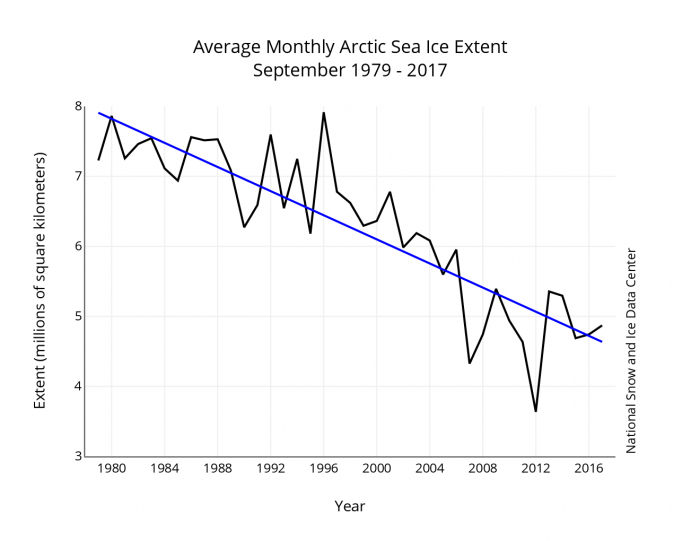
The two lowest September monthly average extents observed in the satellite record are 3.6 million square kilometers in 2012 and 4.3 million square kilometers in 2007. A conclusion drawn from June and July 2018 reports is that it is highly unlikely that there will be a new record low September extent this year. Results from the August 2018 report are consistent with the earlier conclusion—only two of the August projections of total September extent are below 4.0 million square kilometers. While the observed May sea ice extent was well below the long-term average, atmospheric conditions during June and through the first half of July have favored a fairly slow rate of summer ice retreat.
The median prediction of September extent in the Alaska sector is 0.50 million square kilometers; this compares to 0.47 and 0.49 from the June and July predictions, respectively. Observed summer ice loss was slow in this region until late July. The July prediction for total Antarctic extent in September is 18.95 million square kilometers, compared to 18.86 and 18.62 million square kilometers from the July and June predictions, respectively.
This report is organized as follows: (1) an overview of projections of total September Arctic ice extent, (2) predicted spatial fields, SIP, and IFD from dynamical models; (3) current Arctic ice conditions and relationships with atmospheric conditions; (4) regional ice conditions; (5) projections of Antarctic ice extent. Contributions to the 2018 SIPN/Year of Polar Prediction community forecast experiment, the Sea Ice Drift Forecast Experiment (SIDFEx), are still coming in, and will be discussed when available.
This August Sea Ice Outlook Report was developed by lead author Uma Bhatt, U. Alaska Fairbanks, Geophysical Institute (Overview, discussion of modelling contributions, and discussion of regional conditions); Edward Blanchard-Wrigglesworth, U. Washington and Nic Wayland, U. Washington (Discussion on predicted spatial fields); John Walsh, International Arctic Research Center (Discussion of current conditions); Jinlun Zhang, U. Washington, Applied Physics Laboratory (Discussion of sea ice thickness); François Massonett, Université catholique de Louvain (Antarctic contributions); Bruce Wallin, NSIDC (statistics and graphs); Betsy Turner-Bogren, Helen Wiggins, and Stacey Stoudt, ARCUS (report coordination and editing); and the rest of the SIPN2 Leadership Team.
Please note: The Sea Ice Outlook provides an open process for those interested in Arctic sea ice to share predictions and ideas; the Outlook is not an operational forecast.
See August call for contributions
Overview
Of the 39 August 2018 SIO contributions providing projections of September 2018 Arctic sea ice extent, 15 are based on dynamical models, 18 are based on statistical methods, 4 are based on heuristic approaches (qualitative analyses), and 2 are based on mixed methods (a combination of statistical and heuristic approaches) (Figure 1).
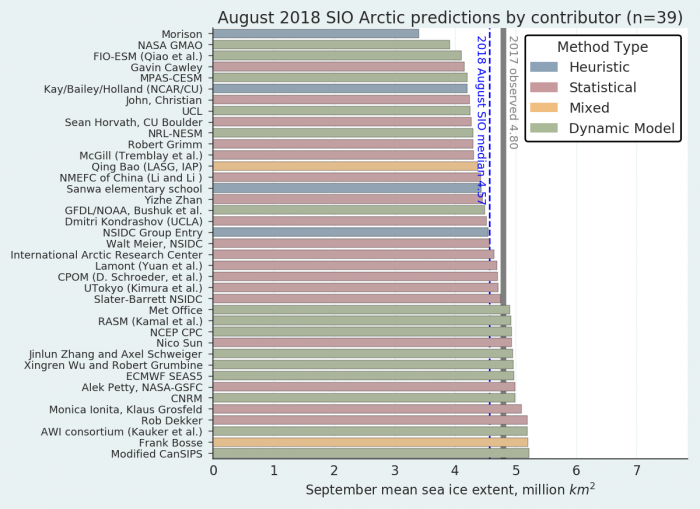
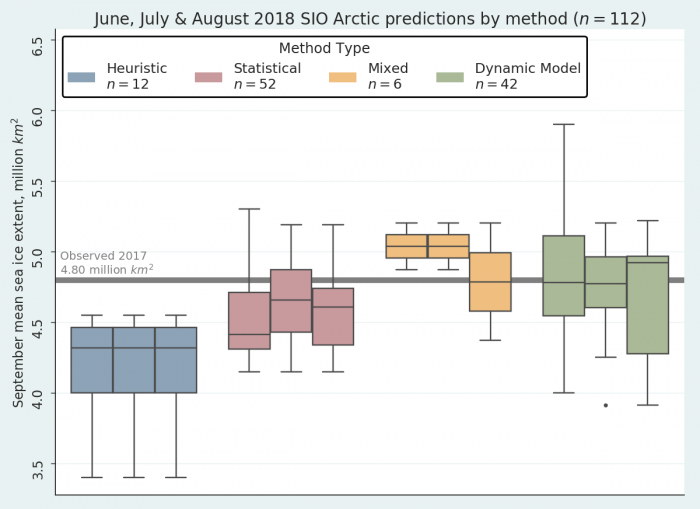
The median projection of total September 2018 sea ice extent based on all methods is 4.6 million square kilometers, with lower and upper quartiles in the distribution of 4.3 and 4.9 million square kilometers, respectively. August projections of September sea ice extent based on dynamical methods had the highest median (4.9 million square kilometers) and largest spread compared to other methods (interquartile range of 4.3 to 5.0 million square kilometers). The median values for August are slightly lower than the July predictions for both the statistical (4.7 to 4.6 million square kilometers) and mixed (5.0 to 4.8 million square kilometers) methods. The heuristic predictions remain unchanged from previous months with a median of 4.3 million square kilometers and an interquartile range of 4.0 to 4.5 million square kilometers. The projection spread between July and August increased for dynamical and mixed methods (by 0.4 million square kilometers for both methods), decreased for the statistical methods (by 0.1 million square kilometers), and remained the same for the heuristic method (Figure 2). For all three months the heuristic method projection is similar while August projections for the statistical, mixed, and dynamical have more outlooks that predict low values for September extent.
The two lowest September monthly average extents observed in the satellite record are 3.6 million square kilometers in 2012 and 4.3 million square kilometers in 2007 (Fig. 3). Only two of this month's projections are for a September extent below 4.0 million square kilometers, similar to the July SIO report. Reinforcing conclusions from previous Outlooks for 2018, based on the projections it is highly unlikely that a new record low September extent will be reached this year.
The median August prediction of September extent in the Alaska sector is 0.49 million square kilometers; this compares to 0.47 and 0.49 million square kilometers from the June and July predictions, respectively. After a slow start, observed summer ice loss sped up in the Alaska Sector starting in July. The August prediction for total Antarctic extent in September is 18.95, an increase from earlier predictions of 18.62 and 18.86 for June and July, respectively.
Comment on Sea Ice Probability (SIP) and First Ice-Free Date (IFD) Predictions from Spatial Fields
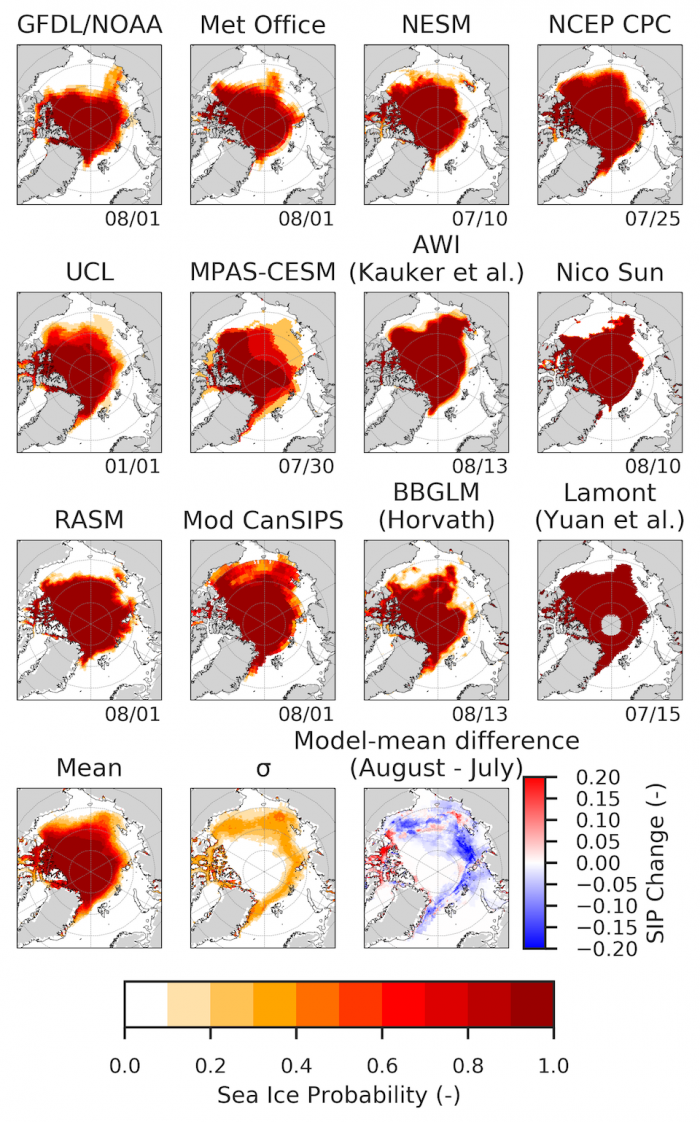
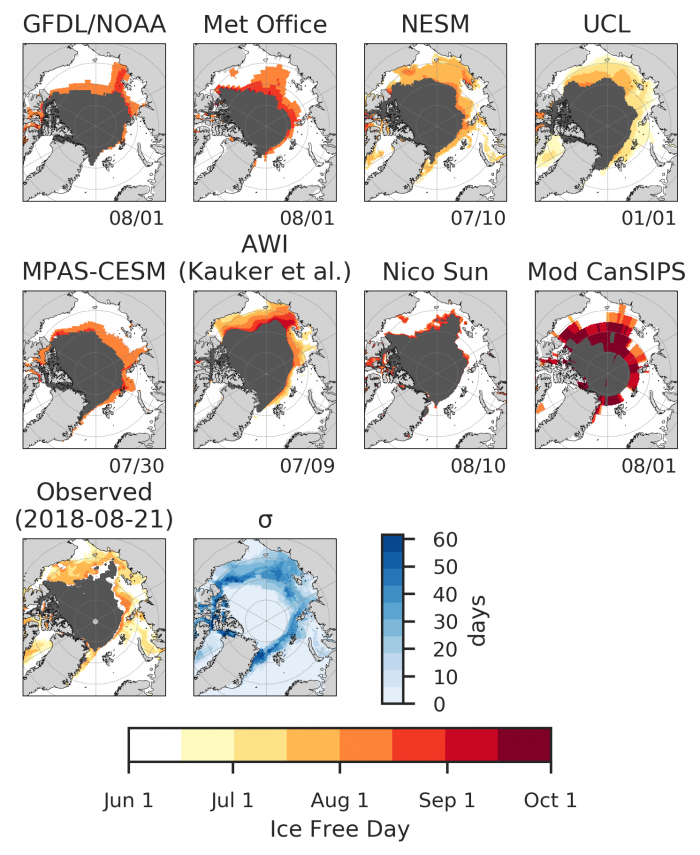
As in recent years, we have invited forecasts of sea ice probability (SIP) and the first ice-free date (IFD). Additionally, SIPN is now producing SIP and IFD forecasts directly from contributors' sea ice concentration (SIC) forecasts, and we encourage contributors to submit full field SIC forecasts whenever possible. SIP is defined on grid cell by grid cell basis as the fraction of ensemble members in an ensemble forecast with September ice concentration exceeding 15%. IFD is the first date in the retreat season at which the ice concentration at a given grid cell first drops below 50% and stays below 50% for the following 10 days. For this August 2018 SIO, we received 12 submissions of SIP (9 dynamical, 3 statistical) and 8 of IFD.
Sea Ice Probability (SIP)
August forecasts of September SIP are similar or slightly below those for July. Forecast uncertainty (the spread) across models is highest in the East Siberian sea, a feature also seen in past years as some models forecast a tongue of sea ice extending south toward the coastline while others forecast open water conditions. Compared to the July multi-model mean, the August multi-model mean forecast has lower SIP over most of the Arctic Ocean except the Canadian Arctic Archipelago (see lower right panel of Figure 4). The largest decreases in multi-model mean SIP are along the northern edge of the Laptev sea into the central Arctic Ocean. Most models now forecast an open Northeast Passage (Northern Sea Route) along the Russian Coast, which will very likely validate as observations for mid-August show the passage as already mostly ice-free. (see Figure 8 below).
Ice-Free Date (IFD)
As was the case in the June and July 2018 SIO, there is a significant spread in IFD predictions across models, the inter-model spread being over a month along the marginal sea ice zone (Figure 5). As might be expected, there is considerable overlap in the regions that show high inter-model spread in IFD and SIP.
Current Conditions
This analysis of observed Arctic sea ice and associated atmospheric conditions draws heavily from NSIDC's Arctic Sea Ice News and Analysis and NOAA's Earth System Research Laboratory.
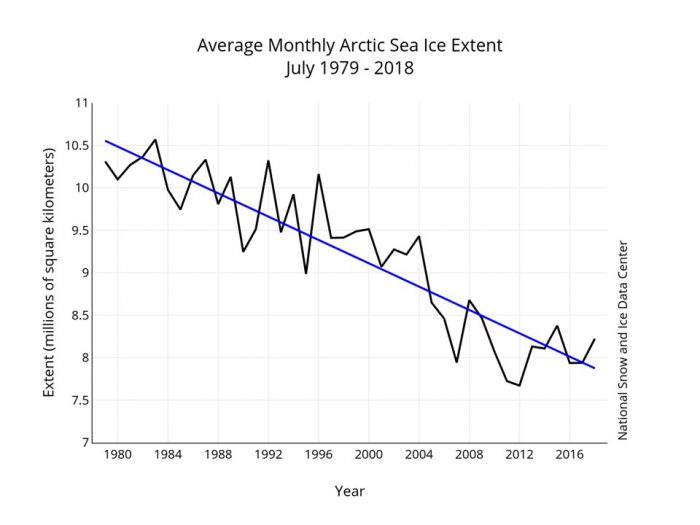
Total sea ice extent for the month of July 2018 was the eighth lowest of the 40-year satellite record dating back to 1979. The total ice extent was about 0.3 million square kilometers higher than in 2016 and 2017, and more than 0.5 million square kilometers above the minimum July extent observed in 2012. However, the July extent was below the values observed in 2015 and in all years prior to 2007. The value for July 2018 is approximately 0.3 million square kilometers above the linear trend line, which corresponds to a loss of about 7.2% per decade. By contrast, July extents of 2016 and 2017 fell almost exactly on the trend line (Figure 6).
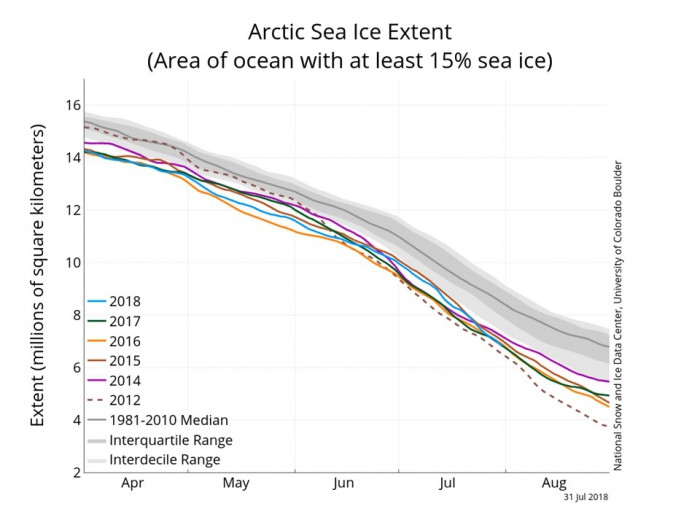
The rate of loss of sea ice accelerated in the second half of July, then slowed slightly in the first third of August. Figure 7 shows the progression of total ice extent in 2018 compared recent years and with the historical ranges (25-75% and 10-90%). It is apparent that the reduction in sea ice extent since early May has been considerably slower than in 2012 and other recent years, largely because of the delayed retreat in June of 2018. While 2018 ranked 2nd-lowest in extent for much of April and May, its rank slipped behind other recent years in June. As discussed in the 2018 Sea Ice Outlook July Report, the relatively slow retreat in June was a consequence of the prevailing winds and air temperatures. The importance of summer winds and temperatures is apparent in the changes (over time) of the ranks of the various years as spring and summer evolve. For example, 2012's ice extent dropped from near the median in April to lowest in the satellite record by August, largely because the winds and temperatures of early summer were especially favorable for ice loss.
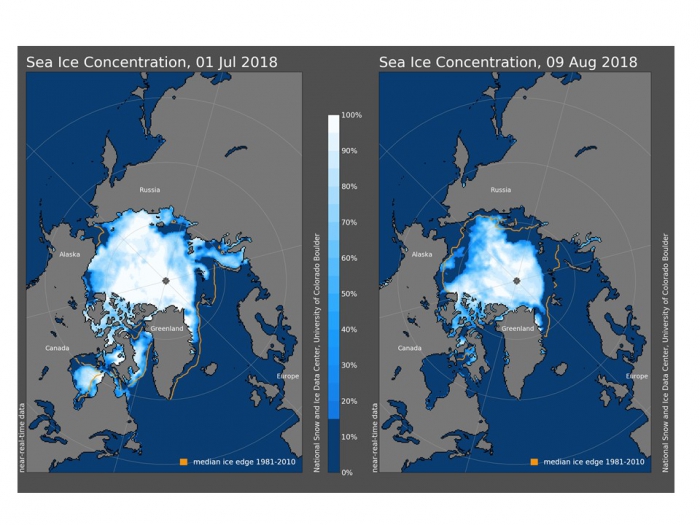
The spatial pattern of the change since the end of June are apparent in Figure 8, which shows ice concentration fields for July 1 and August 9 of 2018. Regions that lost their ice cover completely during July and early August included the Laptev Sea, Baffin Bay, and Hudson Bay. There was a large loss of ice in the East Siberian Seas, as well as the Chukchi and Beaufort Seas. However, an area of low-concentration sea ice remained in the eastern Chukchi Sea and the southwestern Beaufort Sea. Ice extent in early August was well below the 1981-2010 median (orange lines in Figure 7) over much of the Arctic Ocean. The only regions with near-average extent were portions of the East Siberian Sea and the Canadian Archipelago. The remaining ice in the Chukchi-Beaufort region had an outer boundary close to the climatological median position, but there were large areas of open water north of this area of remnant ice. With four to six weeks remaining in the melt season, the remnant patch of ice in the Chukchi-Beaufort region is still highly vulnerable to melting out.
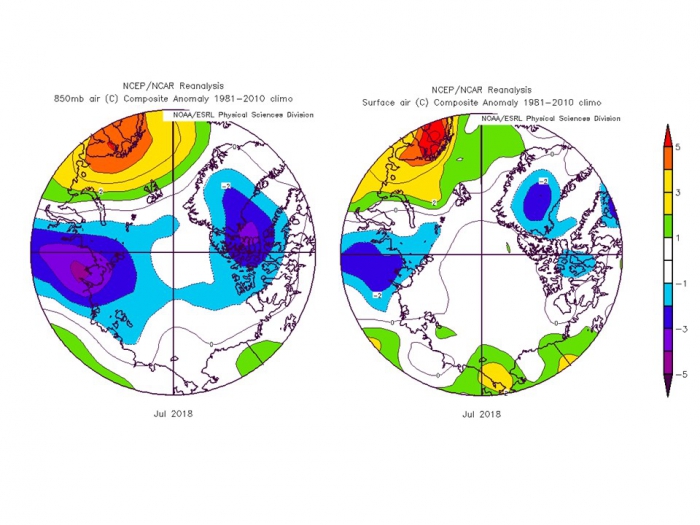
Air temperatures during July 2018 ranged from near average to slightly below average over much of the Arctic Ocean (Figure 9). At 850 hPa (approximately 1.5 km above the surface), the northwestern Russian coastal region was notably colder than average, as was northern Baffin Bay, with a narrow band of negative temperature anomalies exceeding 1°C extending across the Arctic Ocean (Figure 9, left panel). Over the coastal waters of northern Alaska, Chukotka, and eastern Greenland, air temperatures were close to average. Large positive temperatures (up to 5°C) prevailed over Finland and Scandinavia, an area that has been suffering from record summer heat. Nearly the entire Arctic Ocean was within 1°C of the climatological mean for 1981–2010 (Figure 9, right panel).
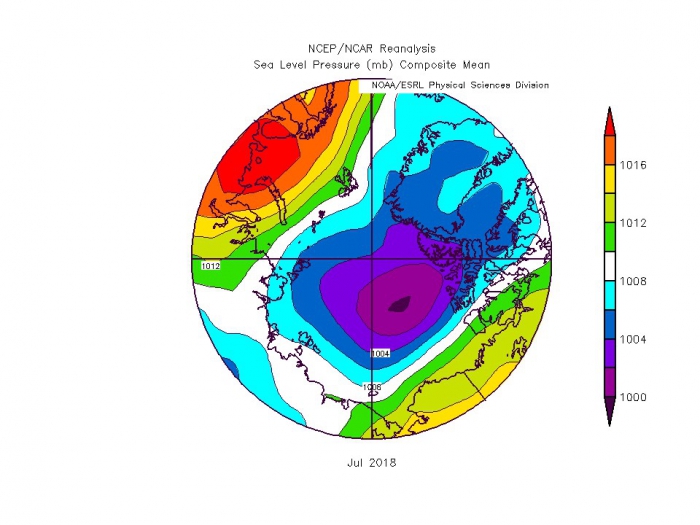
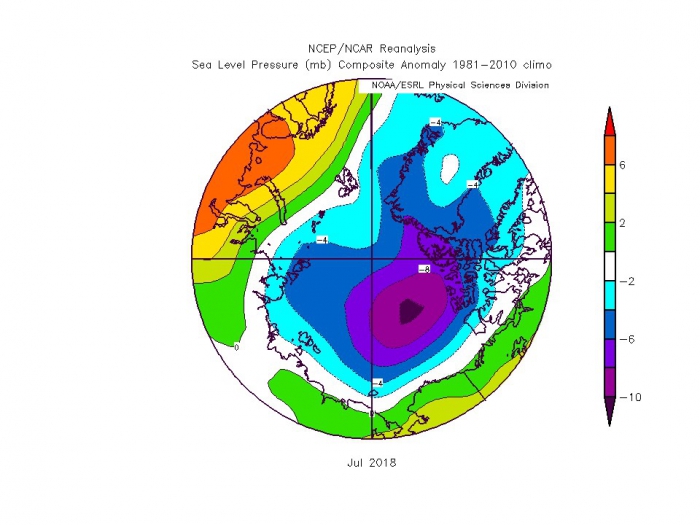
Surface winds, which are determined largely by the sea level pressure pattern, are key drivers of the year-to-year variations of sea ice, especially the regional variations. The sea level pressure field over the Arctic averaged for July 2018 was dominated by low pressure centered about 1,000 km north of the Alaskan coast (Figure 10). The mean low reflects the influences of several cyclones over the Arctic Ocean. An exceptionally strong cyclone in early July attained a central pressure of 968 hPa on July 7. Figure 10 also shows a strong high pressure centered near the coast of the Barents Sea. As seen in Figure 11, pressures were below average by about 10 hPa near the center of the mean low over the Arctic Ocean, while pressures were 6 to 8 hPa higher than normal over the Barents Sea and northwestern Russia (Figure 11). The latter feature was responsible for the advection of anomalous warmth into Scandinavia and Finland. The similarity of Figures 10 and 11 is an indication of the flatness (i.e., absence of strong gradients) in the climatological mean field of sea level pressure over the Arctic in July. Hence any notable pressure centers during July represent departures from the climatological average.
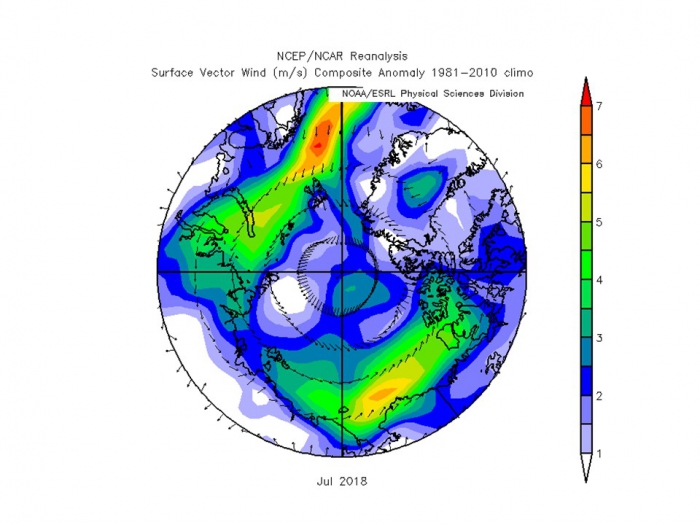
Corresponding to the departures from average sea level pressures are the departures from average surface winds (Figure 12). Anomalous winds from the southeast over the Beaufort and Chukchi Seas are consistent with the substantial loss of sea ice north of Alaska. The wind-forcing over this region favors drift of sea ice towards the southern portion of the Canadian Archipelago. Winds from the south also tend to be warm. By contrast, the wind anomalies over Fram Strait were poleward, limiting the export of sea ice from the Arctic Ocean into the North Atlantic. This poleward wind anomaly over Fram Strait likely limited the loss of sea ice during July of 2018. The poleward wind anomaly over Fram Strait was not present in June of 2018.
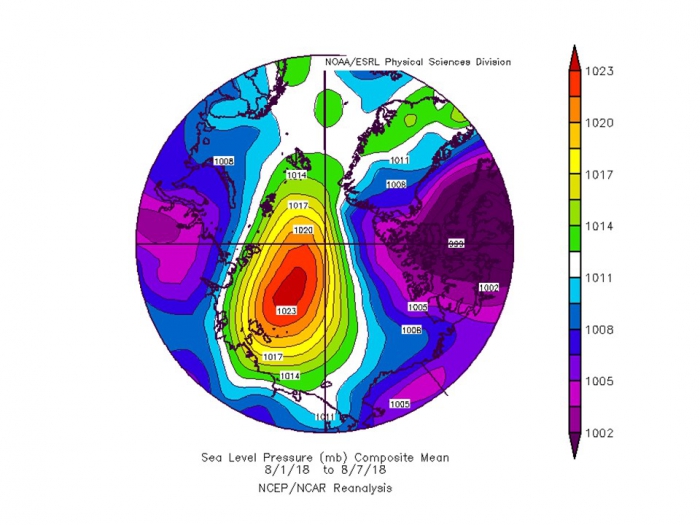
The inability to predict subseasonal variations of the atmospheric circulation is a major challenge in Arctic sea ice forecasting, and the summer of 2018 provides an outstanding example. Figure 13 shows the sea level pressure field for the first week of August 2018. In contrast to the July pressure field in Figure 10, which is dominated by low pressure over the Arctic Ocean, a strong high pressure system was the prominent feature in early August. The early-August pattern is consistent with wind-forcing of the ice towards the Chukchi and East Siberian Seas. The advected ice likely included multiyear ice from the region offshore of the northern Canadian Archipelago. The extent of ice in the Chukchi/East Siberian Sea sector at the time of the September minimum will likely depend on whether or not this anomalous pressure pattern persists.
While monthly and seasonal forecasts of sea level pressure, 500 hPa heights, and air temperature are available from operational models, substantial skill of these forecasts over the Arctic Ocean has yet to be documented. The most recent forecasts from NOAA's CFSv2 model suggest that the pattern shown by Figure 8 will persist through mid-August and break down thereafter. Figure 14 shows the September sea level pressure forecasts from the NOAA's CFSv2 and Canadian CanSIPS models. The CFSv2 map is an average of nine ensemble members. In both cases, the pressure fields over the Arctic are quite flat and the departures from average quite small. If this forecast verifies, we would not expect any drastic departures from the current trajectory of total ice extent leading into the seasonal minimum. In addition, the contributed SIPN forecasts based on dynamical models with climatological wind forcing will not suffer from large errors to to unusual winds conditions in September.
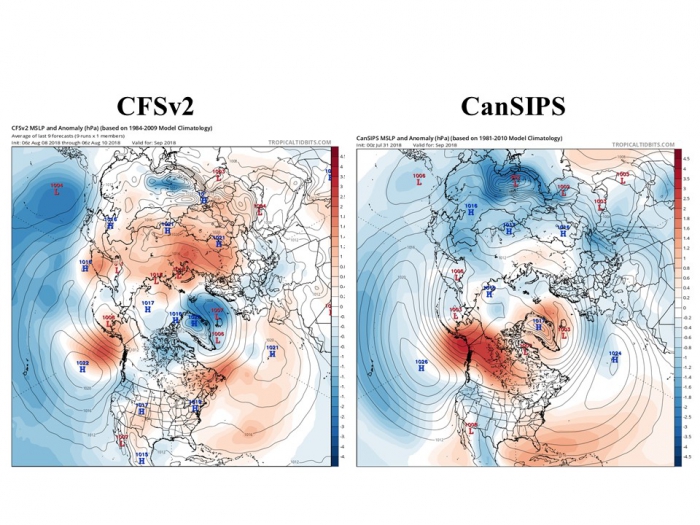
Image source: Tropical Tidbits
Finally, Figure 15 shows the forecast field of September air temperatures at the 2-meter level. This field is an average of forecasts by the North American Multi-Model Ensemble (NMME), a set of seven participating models from the U.S. and Canada. The temperature departures are relative to the models' respective climatologies for September. The forecast is for generally positive anomalies over the Arctic Ocean, ranging from 0°C to about 1.5°C. However, it must be noted that these models are coupled atmosphere-ocean-ice models, and the surface air temperature anomalies over the marginal ice zone Arctic Ocean will depend strongly on the anomalies of sea ice. Based on Figure 15, these coupled models likely project negative anomalies of sea ice in the Chukchi and Kara Seas, where the temperatures show maximum positive departures from the models' climatologies.
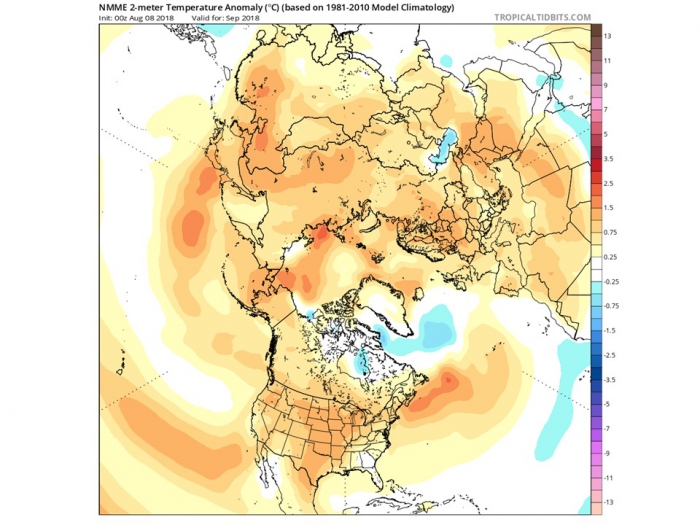
Image source: Tropical Tidbits
Regional Sea Ice Extent and Ice Thickness Discussions
Alaska Regional Extent Outlooks
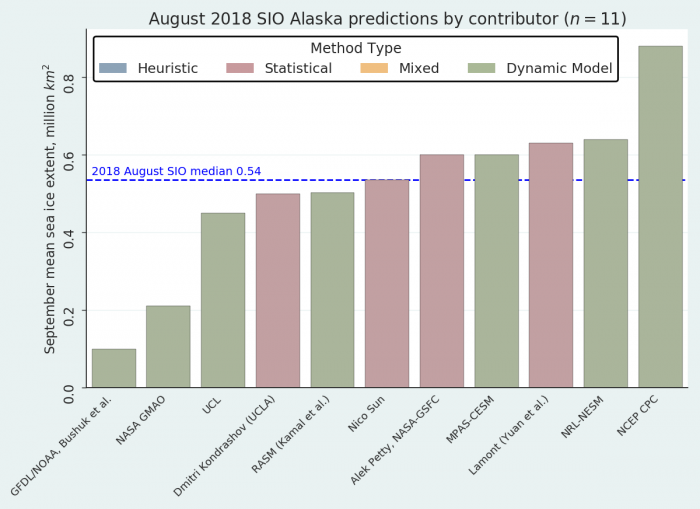
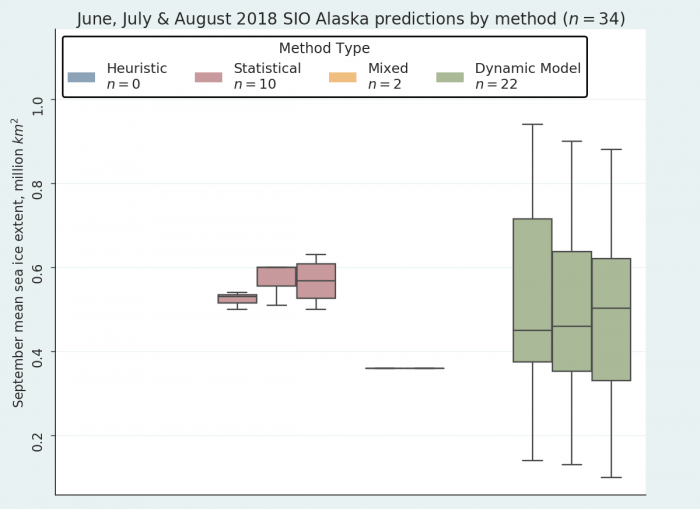
The August 2018 SIO report received 11 September outlooks (four statistical and seven dynamical) for the Alaska region, which combines the Bering, Chukchi, and Beaufort Seas (Figure 16). The median of the 11 predictions for September is 0.54 million square kilometers, up from the July forecast of 0.49 million square kilometers. Seven of the forecasts were based on dynamical models, with a median forecast of 0.5 million square kilometers, whereas the four statistical forecasts suggested slightly higher overall extent of 0.6 million square kilometers. This likely reflects the overall slow loss of ice in this region despite record low extents within the Bering Sea this last winter. Interestingly, two dynamical model forecasts predict that ice should retreat significantly by September, with a regional extent of 0.2 million square kilometers or less. The projections for September 2018 sea ice are consistently lower for all 2018 Outlooks for dynamical than statistical models (Figure 17).
Beaufort and Chukchi Seas
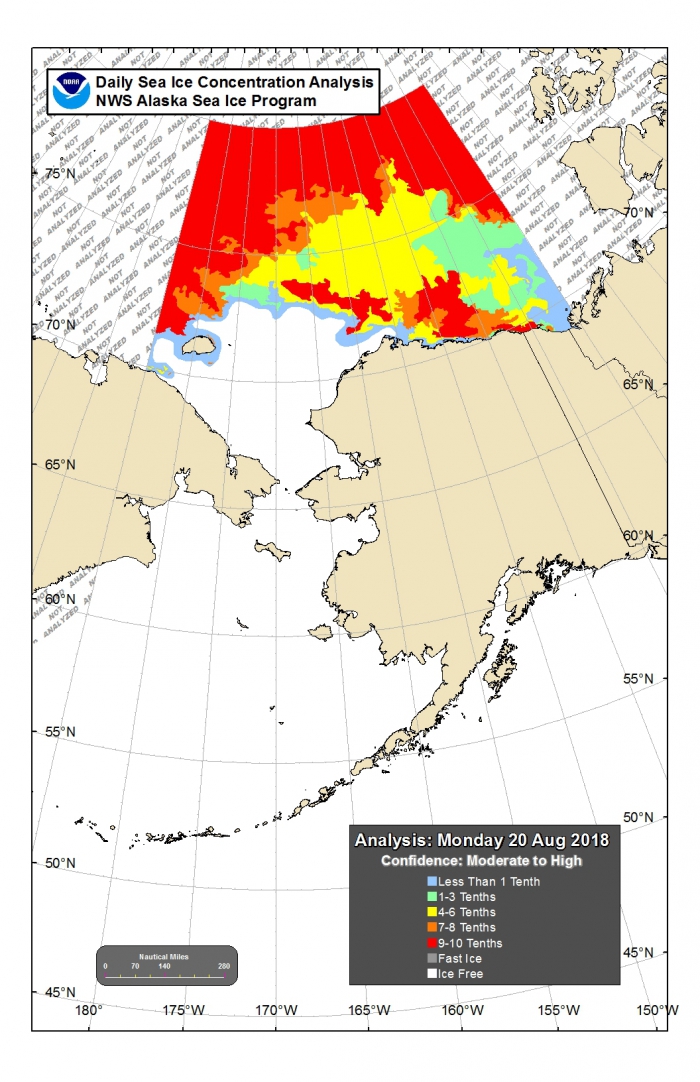
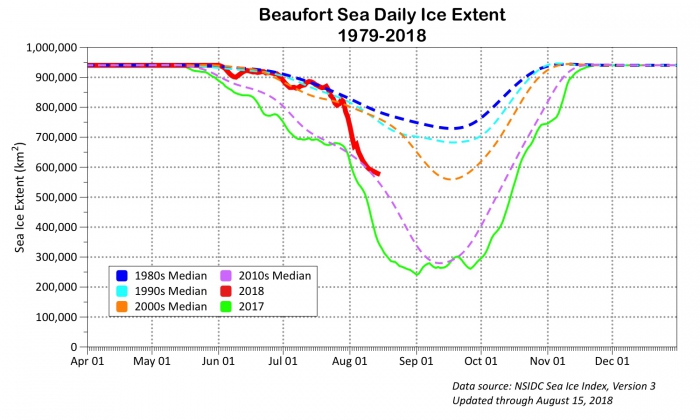
Observed sea ice concentration in the Chukchi Sea for August 15, 2018 was typical of the post-2000 period (Figure 18) and reduced from previous decades. Ice in the Beaufort Sea is more extensive than in previous years and is more typical of previous decades at least until late July (Figure 19). The National Weather Service (NWS) Alaska Sea Ice Program (ASIP) map combines satellite observations with additional local information and shows more ice in the Beaufort and higher sea ice concentrations that than depicted in passive microwave fields (see Figure 8). Despite the extreme low sea ice in spring in the Beaufort Sea, conditions were not conducive to melting early in the season due to weak winds and generally high pressure. Since late July sea ice melt has accelerated in the Beaufort Sea, but ice extent still exceeds that observed in 2017 (Figure 19).
Sea Ice Thickness Forecast
(Provided by SIO contributor Dr. Jinlun Zhang)
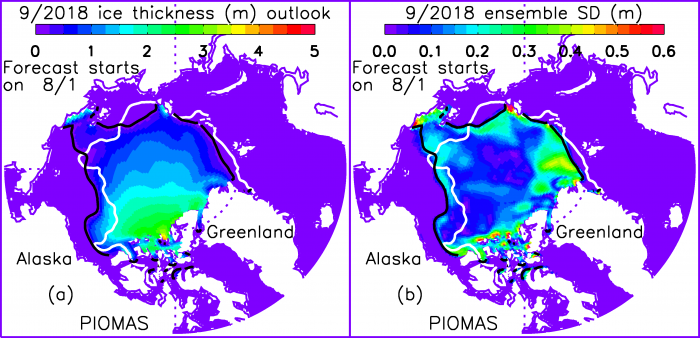
The predicted September 2018 Arctic sea ice thickness field and ice edge location, using Pan-Arctic Ice-Ocean Modeling and Assimilation System (PIOMAS, Zhang and Rothrock, 2003), is presented in Figure 20. This is shown along with uncertainty based on the ensemble standard deviation (based on 4 ensemble members). PIOMAS is a numerical seasonal forecasting system driven by NCEP CFS forecast atmospheric forcing. The predicted total September ice extent, projected forward from August 1 initial conditions, is 4.95± 0.40 million square kilometers. (For further details, see: ![]() Supplemental Sea Ice Thickness Outlook, Zhang and Schweiger.)
Supplemental Sea Ice Thickness Outlook, Zhang and Schweiger.)
Antarctic Discussion
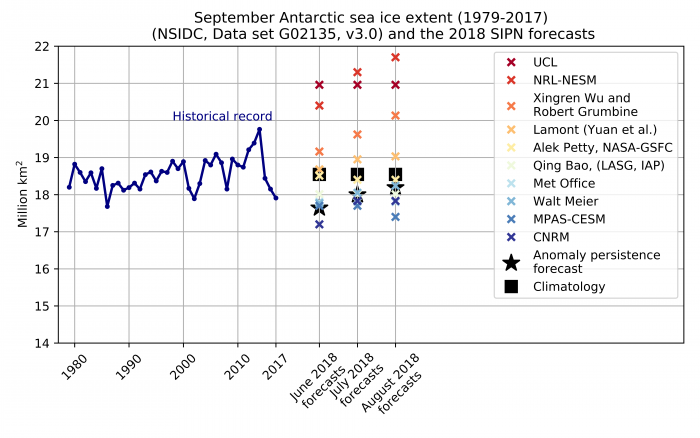
For this August report, we received 10 forecasts of total September Antarctic sea ice extent (5 are re-submissions from the July report). Forecasted extent have tended to increase over time, as reflected in the change in the ensemble mean forecasts of 18.62, 18.86, and 18.95 million square kilometers for June, July, and August, respectively (Figure 21). This increase is also seen in the evolution of the anomaly persistence forecast, and results from a faster-than-average rate of sea ice expansion over the last three months. Both the SIPN forecasts and the persistence forecast suggest that a record high or low is unlikely to occur for this year. An alternate depiction of the Antarctic forecasts is shown in Figure 22 to be consistent with pan-Arctic and Alaska region forecasts.
There is a very large spread in the forecasts, and that spread does not become smaller and shorter lead times. That is, new information acquired in June and July does not substantially make the forecasts more certain. It is worth noting that, unlike the Arctic forecasts, Antarctic forecasts are not bias-corrected by their providers.
The Sea Ice Prediction Network South will extend these analyses by coordinating a forecast for austral summer 2018-2019 and investigating the regional expression of forecast biases and uncertainties.
References
Zhang, J., and D.A. Rothrock: Modeling global sea ice with a thickness and enthalpy distribution model in generalized curvilinear coordinates, Mon. Wea. Rev., 131(5), 681–697, 2003.
Summary Table Of Key Statements From Individual Outlooks
![]() Summary Table of Key Statements from Individual Outlooks
Summary Table of Key Statements from Individual Outlooks
Individual Outlook PDFs
This 2018 Sea Ice Outlook August Report was developed by the SIPN2 Leadership Team
Report Lead:
Uma Bhatt, University of Alaska, Geophysical Institute
Additional Contributors:
John Walsh, International Arctic Research Center
Edward Blanchard-Wrigglesworth, University of Washington, Department of Atmospheric Sciences
Nicholas Wayand, University of Washington, Department of Atmospheric Sciences
François Massonnet Université catholique de Louvain
Jinlun Zhang University of Washington, Applied Physics Laboratory
Bruce Wallin, University of Colorado, Boulder, NSIDC
Editors:
Betsy Turner-Bogren, ARCUS
Helen Wiggins, ARCUS
Stacey Stoudt, ARCUS
Suggested Citation:
U. S. Bhatt, J. Walsh, E. Blanchard-Wrigglesworth, N. Wayand, F. Massonnet, J.Zhang, W. Meier, M. Serreze, J. Stroeve, L. C. Hamilton, C. M. Bitz, J. E. Overland, H. Eicken, H. V. Wiggins, M. Wang, P. Bieniek, J. Little, J. Kurths, M. Steele, E. Hunke,T. Jung, and B. Wallin. Editors: Turner-Bogren, B., H. V. Wiggins and S. Stoudt. July 2018. "Sea Ice Outlook July Report." Published online at: https://www.arcus.org/sipn/sea-ice-outlook/2018/august.


