Table of Contents
- Section 1. Post-Season Highlights
- Section 2. Introduction/Overview
- Section 3. Review of Observed Arctic 2019 Conditions
- Section 3a. Observed Arctic Sea Ice
- Section 3b. Ocean Heat Conditions
- Section 3c. Discussion of 2019 Fall Ice Advance
- Section 3d: Atmospheric Conditions
- Section 4. Review of The 2019 Sea Ice Outlooks
- Section 4a. Overview of the 2019 Sea Ice Outlook (SIO)
- Section 4b. Review of Statistical Methods
- Section 4c. Review of Dynamical Models and Methods of Forecast Initialization
- Section 4d. Spatial Forecasts of September Sea Ice Extent Probability (SIP)
- Section 4e. Review of Regional Alaska Forecasts
- Section 5. Further Analysis of the Sea Ice Outlooks
- Section 5a. Probabilistic Assessment of the 2008-2019 Outlooks: Comparison between SIO Contributions and Control Forecasts
- Section 5b. Evaluation of SIO Forecast Skill Relative to Control Forecasts
- Section 6. Antarctic Contributions
- Section 7. Sea Ice Drift Forecast Experiment (Sidfex) Results
- Section 8. Sea Ice Forecasts for The Alaska Marine Shipping Industry
- Report Credits
- References
Section 1. Post-Season Highlights
The Sea Ice Outlook (SIO) is a community network activity led by the Sea Ice Prediction Network-Phase 2 (SIPN2) Project Team with contributions from key partners. SIPN2 is a community of scientists and stakeholders with the goal of advancing our understanding of the state and evolution of Arctic sea ice cover.
Report Highlights:
- The observed September monthly averaged sea ice extent was 4.32 million square kilometers based on data from the National Snow and Ice Data Center (NSIDC) Sea Ice Index (SII).
- A total of 112 pan-Arctic September extent forecast submissions were received during the 2019 SIO season, including a record number of 42 submissions for the August report.
- While the July median of SIO contributions, 4.28 million square kilometers, was closest to the observed September extent of 4.32 million square kilometers, the range of contributions to the August report were narrower providing a more precise forecast.
- An important aspect of forecasting is providing useful uncertainty ranges; the narrowed range in August thus has a beneficial impact for stakeholders.
- Summer 2019 Arctic air temperatures were anomalously high, ranging from 2.5 to 4 ˚C over the central Arctic Ocean.
- The observed 2019 September extent in the Alaskan region was 0.35 million square kilometers according to NSIDC, mainly due to extremely low sea cover in the Chukchi Sea.
- Unusually warm waters persisting along the Alaskan Beaufort and Chukchi Seas even by the end of October with unprecedented values up to 2ºC north of 75ºN, which significantly delayed ice growth.
- 2019 saw the third latest freeze-up in the Chukchi Sea, surpassed by 2016 and 2017. The lack of ice in the Chukchi Sea was a significant contributor to satellite-era record low Arctic extent during October and November
This 2019 Post-Season Sea Ice Outlook Report was developed by lead author Uma Bhatt, University of Alaska Fairbanks, Geophysical Institute (Overview, discussion of atmospheric conditions, and review of the 2019 SIOs); Walt Meier, NSIDC (Discussion of Arctic sea ice); Michael Steele, University of Washington (Discussion of ocean heat conditions); Kevin Wood, University of Washington (Discussion of Fall Arctic sea ice advance); Muyin Wang, (Review of statistical methods and review of regional forecasts); Ed Blanchard-Wrigglesworth, University of Washington (Discussion of spatial forecasts of September sea ice extent probability); John Walsh, International Arctic Research Center (Discussion of probabilistic assessment of the 2008-2019 SIOs); Larry Hamilton, University of New Hampshire (Discussion and evaluation of SIO foreccst skill relative to control forecasts); François Massonnet, Université Catholique de Louvain (Discussion of Antarctic contributions); Helge Goessling, Alfred-Wegener Institute (Discussion of SIDFEx results), Joseph Little, University of Alaska (Discussion of sea-ice forecasts for the Alaska marine shipping industry); Molly Hardman, NSIDC (Statistics and graphs); and Betsy Turner-Bogren and Helen Wiggins, ARCUS (report coordination and editing); and the rest of the SIPN2 Leadership Team.
Section 2. Introduction/Overview
SIPN2 is a community of scientists and stakeholders with the goal of advancing our understanding of the state and evolution of the Arctic sea ice cover. The SIO is a community network activity led by the SIPN2 project team with contributions from key partners and the community. This Sea Ice Outlook (SIO) Post-Season Report provides in-depth analysis of factors impacting pan-Arctic September minimum sea ice extent this past summer, reviews of the 2019 SIOs, and discussions of the additional topics listed in the table of contents.
We are grateful for the excellent participation by contributors to the 2019 SIO to sustain this activity. This year we received a total of 112 submissions of pan-Arctic September extent forecasts, with 31 in June, 39 in July, and a record number of 42 submissions in August. The full field analysis was facilitated by the SIPN sea ice forecast data portal that continuously collects forecasts, expanding the forecasts to other seasons beyond the September minimum. The portal provides access to datasets and tools to perform analysis using a Jupyterhub. For SIO forecasts for the "Alaskan Region" (extent in the combined Chukchi, Bering, and Beaufort seas) we received 6 contributions in each of the months of June, July, and August. Forecasts for Hudson Bay were solicited for the first time this year and we received 6 in each of the months of June, July and August.
Section 3. Review of Observed Arctic 2018 Conditions
Section 3a. Observed Arctic Sea Ice
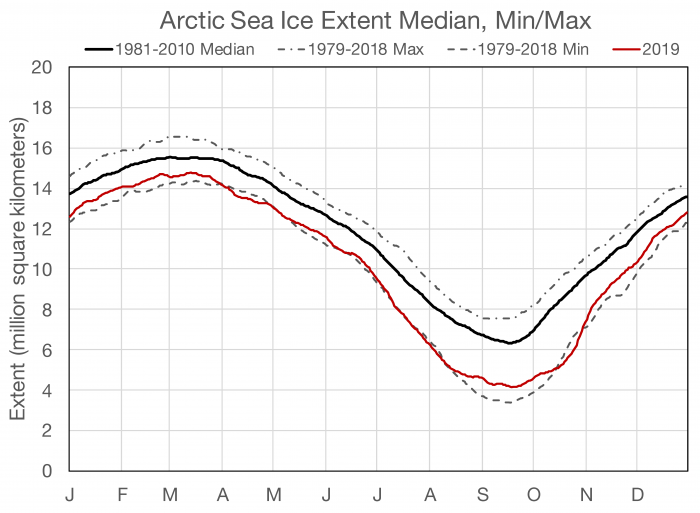
Arctic sea ice extent was well below average throughout 2019, but with substantial variability throughout the year. Winter 2019 extent was not as extreme compared to the previous four years (2015 to 2018), which were the four years with the lowest winter extent in the satellite record (since 1979). The seasonal daily maximum extent for 2019 of 14.78 million square kilometers was reached on March 13, which was the seventh lowest in the satellite record and the highest since 2014. After the maximum, the seasonal onset of melt and retreat of the ice was particularly early, contributing to record low extent during April. Throughout May and June, the rate of ice loss remained well below average. Extent dropped to record low levels in mid-July through early August, but the loss then slowed considerably compared to average. The seasonal daily minimum extent, reached on September 18, tied with 2007 and 2016 as the second lowest extent in the satellite record at 4.15 million square kilometers (1.60 million square miles). The SIO collects September monthly averaged sea ice extent, which was observed to be 4.32 million square kilometers, based on data from the National Snow and Ice Data Center (NSIDC) Sea Ice Index (SII).
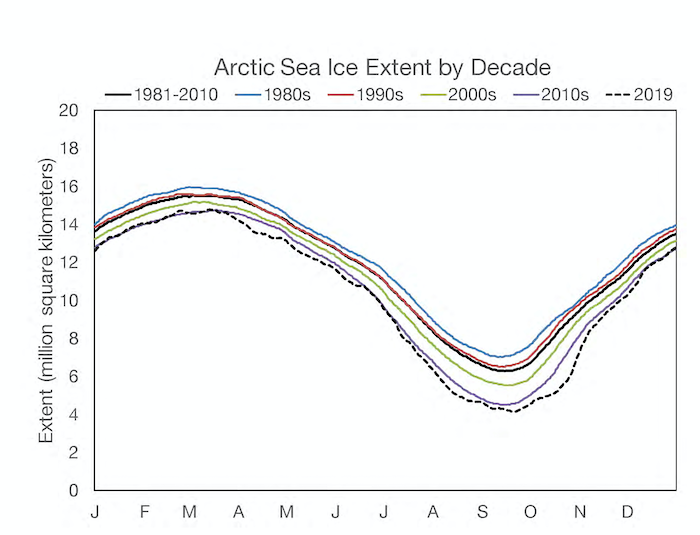
Autumn freeze-up was initially slow, particularly in the Chukchi Sea, which retained open water until late December, far later than normal. 2019 saw the third latest freeze-up in the Chukchi Sea, surpassed by 2016 and 2017. The lack of ice in the Chukchi Sea was a significant contributor to satellite-era record low Arctic extent during October and November. For a period in October, the extent was further below average for a given day than any previous day in the satellite record. In other words, October 2019 saw record low extent that was more than 3 million square kilometers below the 1981 to 2010 climatological average. The most extreme anomaly occurred on October 18, with an extent that was 3.08 million square kilometers below average. One of the key factors in driving slow freeze-up and low extent was the significant retention of heat in the upper ocean, which is discussed in the next section.
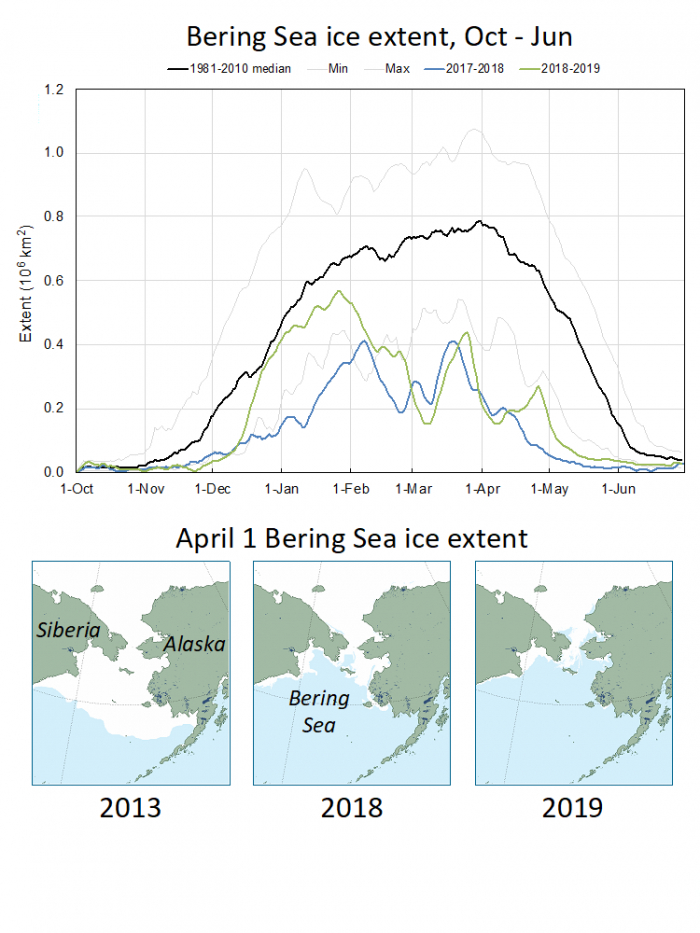
As was also the case in 2018, the Bering Sea had extremely low sea ice cover during the winter of 2019, though the details were quite different. In 2018, the Bering Sea extent remained low throughout the winter months (January through March). In 2019, extent was low, but not unusually so through late-January. Thereafter, the Bering Sea saw rapid reduction in ice extent throughout February and into early March, by which point the extent in 2019 was lower even than during the same time period in 2018. There was some recovery thereafter, but the extent remained near or below the record low 2018 levels through the spring.
See NSIDC Sea Ice News and Analysis.
Section 3b. Ocean Heat Conditions
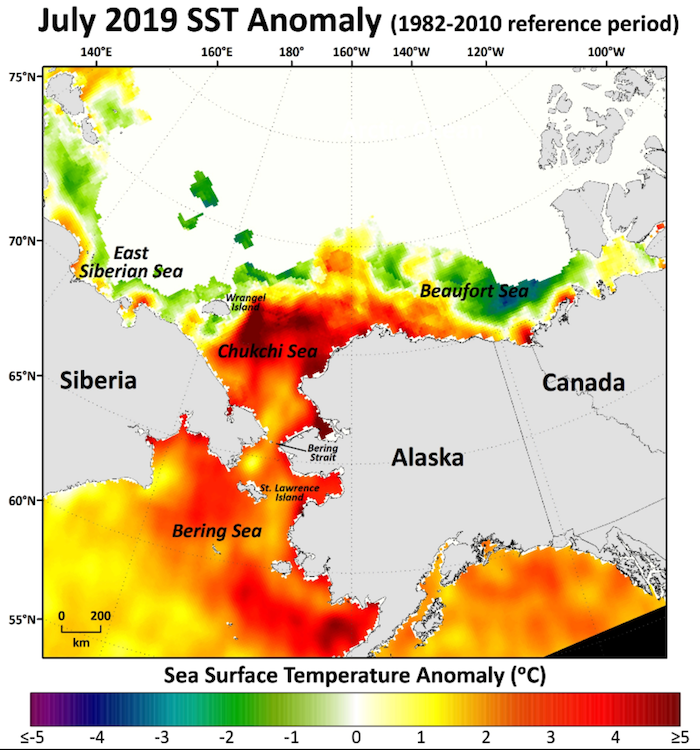
Strong ice retreat in spring and summer 2019 led to anomalously high sea surface temperatures (SSTs). The pace of this ocean warming was rapid, but not unusual, in most locations (within the context of recent years). An exception was the western Beaufort Sea. Sea ice retreat and associated ocean warming occurred with its usual pattern along the North American Arctic Ocean coast, with early retreat and warming in the eastern Chukchi and Beaufort Seas. However, ice retreated completely by early June, allowing ocean warming to begin along the Alaskan Beaufort Sea coast 4-6 weeks earlier than usual. The resulting SST anomaly map for July 2019 (Figure 3b-1) shows warm conditions relative to climatology from the Gulf of Alaska north into the Bering and Chukchi Seas and around to the Alaskan Beaufort Sea, tapering toward a more mixed condition of high and low values compared to average in the Eastern Beaufort and East Siberian Seas.
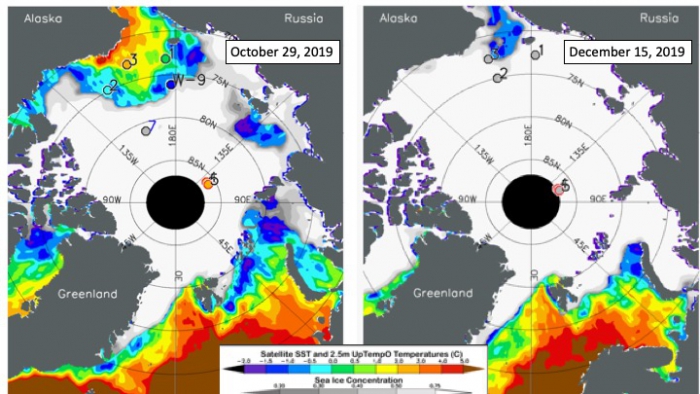
As noted in Section 3a, autumn ice advance in the Chukchi Sea was strongly delayed this year. Figure 3b-2 shows unusually warm waters persisting along the Alaskan Beaufort and Chukchi Seas even by the end of October. Even more unusual is the northward extent of ocean heat at this time, with unprecedented values up to 2ºC north of 75ºN, which significantly delayed ice growth. This ocean heat was gained largely in July, and attained maximum values by early August, in keeping with the idea of the Late Summer Transition described in Steele and Dickinson (2016). The idea is that by mid/late August, atmospheric warming is present but weak, while surface winds begin to accelerate and mix surface heat downward. This wind-forced mixing eventually overcomes the net atmospheric warming, resulting in a gradual SST cooling during late summer that accelerates in autumn when the net surface energy balance changes from positive to negative.
By mid-December, most of this ocean heat had been lost to the overlying cold atmosphere and outer space (although there was still an unusual amount of open water in the Chukchi Sea that remained just above freezing). By the following week, ice concentrations were above 50% and SSTs were uniformly at the freezing point throughout the western Arctic Ocean.
See: UpTempO.
Section 3c: 2019 Fall Ice Advance in the Arctic
In 2019, like other recent years, Arctic sea-ice extent (Fetterer et al. 2017) was well below average in all seasons (Figure 3c-1). At the beginning of the fall freeze-up on September 18, daily sea-ice extent was tied with 2007 and 2016 as the second lowest in the satellite record at 4.15 million square kilometers (NSIDC 2020) (see Section 3b). This extent is 2.18 million square kilometers below the median climatology (1981-2010). The rate of ice advance was also near record minimum in the early part of the season, but later accelerated as residual summer heat was removed from the ocean by the onset of colder winter weather (see Section 3b). At the beginning of freeze-up the delay in reaching median extent (6.33 million square kilometers) was 39 days, converging to a delay of 13 days to reach 12 million square kilometers.
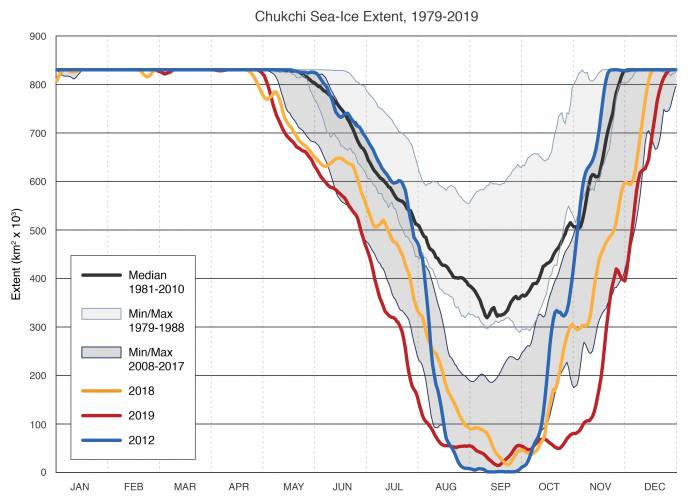
This pattern of low sea-ice extent and delay in ice advance in 2019 was particularly notable in the Chukchi Sea (Figure 3c-2). From early May until mid-August, and again from mid-October to mid-November, sea-ice extent was the lowest observed in the satellite era. The time required for the sea ice to advance from nearly ice-free conditions to the once normal minimum of 320,000 square kilometers was 70 days. The rate of advance was especially low in October and November. This period is congruent with a large open water area observed in the central and northern Chukchi Sea. The Chukchi was not fully ice-covered until the latter part of December, about 25 days later than normal. Sea ice characteristics in the Chukchi Sea, including the timing of melt and freeze, and the area of open water in the summer, are entirely different compared to the first decade (1979-88) of the satellite record (Perovich et al. 2019).
Section 3d: Atmospheric Conditions
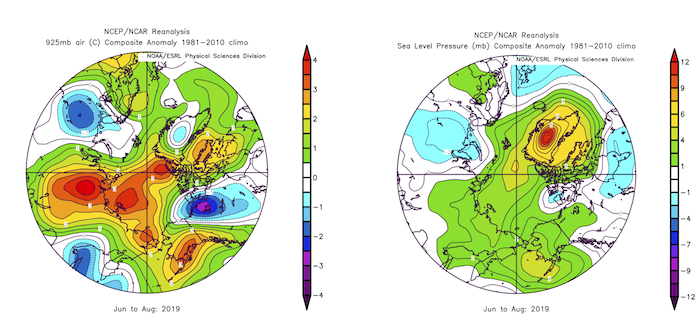
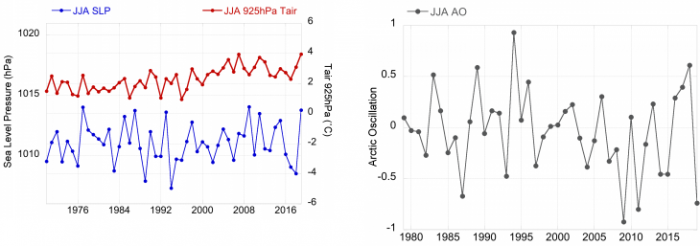
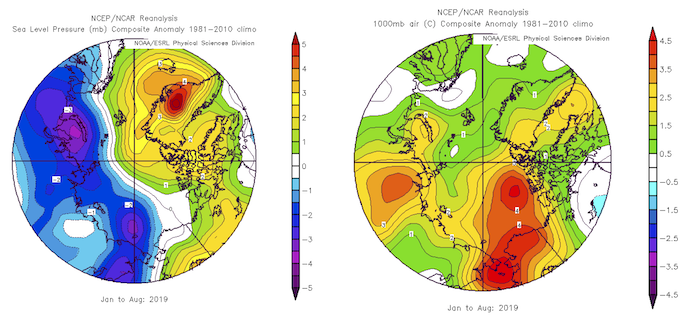
Summer 2019 Arctic temperatures were anomalously high. Seasonal (June-August) 925 hPa air temperature anomalies (Figure 3d-1, left) ranged from 2.5 to 4˚C over the central Arctic Ocean, the Canadian high Arctic, the Laptev Sea, and Chukotka (For detail of regional seas, see Map of Arctic Seas (PDF) below). June to August 925 hPa temperatures were the highest recorded over the 1979-2019 period (Figure 3d-2, left). Seasonal (June-August) sea level pressure anomalies (Figure 3d-1, right) were positive over the Arctic Ocean, consistent with reduced cloud cover and above average lower tropospheric air temperatures. Sea level pressure from 70-90˚N tied for third highest over the 1979-2019 period (Figure 3d-2, right). The Arctic Oscillation Index averaged over June-August 2019 was -0.74 and among the lower values seen over the satellite record (Figure 3d-2, right). The negative AO phase favors a reduction of sea ice extent by convergence of the ice edge (Ogi and Wallace, 2007). The low 2019 sea ice extent is associated with these Arctic summer temperatures and circulation patterns that were favorable for ice loss. Given the temperature anomalies, the ice loss may have been greater if the summer of 2019 experienced any significant storminess.
Within the Arctic, positive sea level pressure anomalies extending from the Greenland Sea westward across northern Canada combined with negative pressure anomalies across the Russian Arctic seas to produce the positive phase of the Arctic Dipole pattern (Wang et al., 2009). This pattern favors stronger-than-normal wind-driven ice transport from the Pacific sector to the Atlantic sector of the Arctic. In addition, temperature advection associated with this pattern favors the large positive temperature anomalies over the Pacific subarctic and the absence of such anomalies over the Atlantic side of the Arctic Ocean (Figure 3d-3, right).
This dipole pattern resulted in large poleward departures in the location of the ice edge in the Pacific sector of the Arctic. In the Beaufort, Chukchi, East Siberian, and Laptev Seas, the ice edge was up to several hundred kilometers poleward from the historical (1981-2010) median ice edge location. By contrast, the ice edge was generally close to its historical median position in the Atlantic sector from Fram Strait to the region north of the Barents Sea. Small southward departures were even observed immediately east of Svalbard. This pattern of departures from average is consistent with the wind-forcing and associated ice drift over the January–August period of 2019, as shown by the departures from average sea level pressures during this period (Figure 3d-3, left). While the temperature anomalies (Figure 3d-3, right) in the Bering, Chukchi, and Beaufort Seas were amplified by the absence of sea ice, the large-scale atmospheric circulation clearly shaped the spatial pattern of sea ice anomalies in 2019.
Section 4. Review of The 2019 Sea Ice Outlooks (SIO)
Section 4a. Overview of the 2019 SIOs
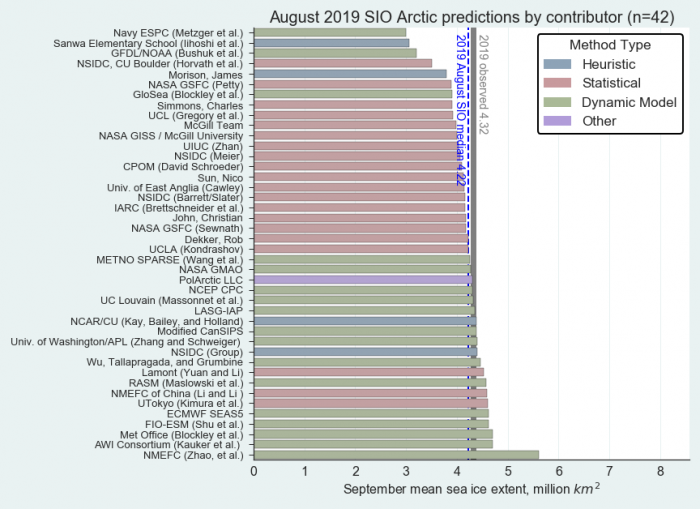
The medians of the Outlook contributions for June, July, and August were 4.40 ±0.58, 4.28 ± 0.49, and 4.22 ±0.46 million square kilometers, respectively, with the July median SIO coming closest to the observed September extent of 4.32 million square kilometers. The standard deviation of the 112 predictions was 0.52 million square kilometers. Forecasts made in August were for slightly lower ice extent (Figure 4a-1), which may reflect the fast pace of ice loss observed in July. However, after the beginning of August, the rate of ice loss slowed significantly in response to changing atmospheric conditions, and the August Outlook forecasts estimated the mean September extent within the uncertainty range of the observations. Regardless, the interquartile range of the projections from June (4.2 to 4.8 million square kilometers), July (4.0 to 4.6 million square kilometers), and August (4.0 to 4.4 million square kilometers) bracketed the observed September extent. While the August median was less accurate than in July, the interquartile range was narrower and thus provided a more precise forecast. An important aspect of forecasting is providing useful uncertainty ranges; the narrowed range in August can have a beneficial impact for stakeholder use. The observed September 2019 extent fell very near the long-term linear trend line. In the past, Outlooks have performed well when the observed extent is near the trend line (Stroeve et al., 2014). Outlier years are more difficult to predict and the performance of Outlooks in such years has generally been less skillful.
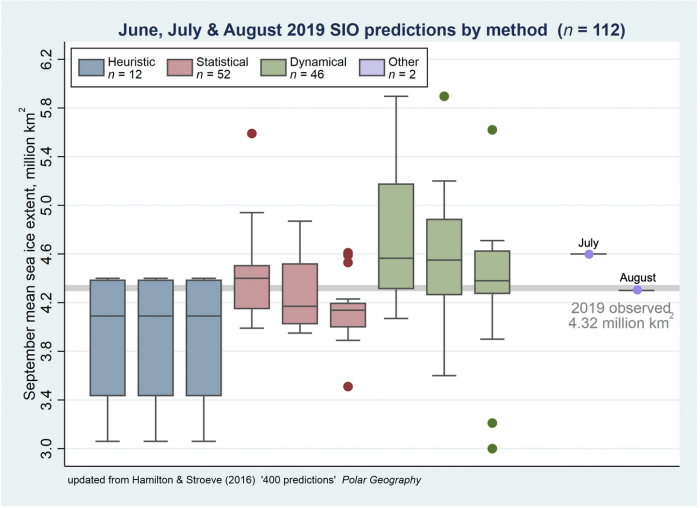
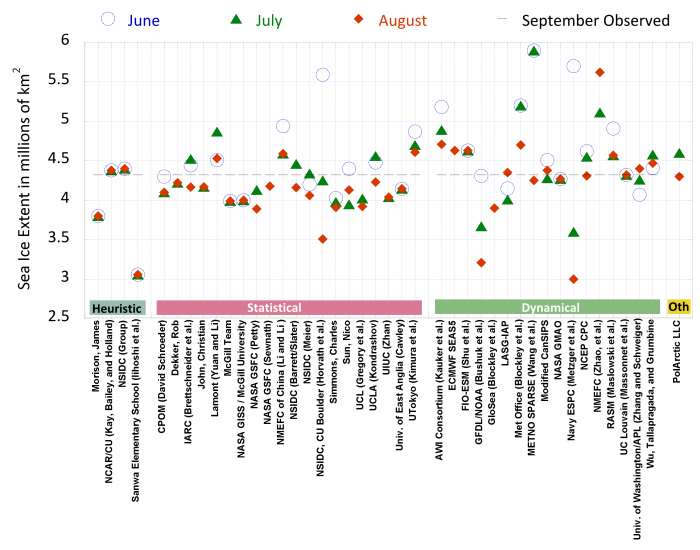
Comparing the different methods, the best performing method varied by month (Figure 4a-2). For example, statistical methods performed best in June and July, with the two estimates' interquartile ranges bracketing the observed extent, although the uncertainty is large. However, the statistical methods' forecasted extents were too low in August, while the dynamic models honed in most closely to the observations. The dynamic model interquartile range just barely bracketed the observed extent in all three months, with the median extent falling above observed. Heuristic and other prediction methods had a limited number of contributions, making assessments more difficult. In general, heuristic methods forecasted a lower September ice extent than observed. Figure 4a-3 shows additional details about how individual forecasts evolved over the season. The dynamical forecasts had more forecasts above the observed ice extent (Figure 4a-3), while the statistical forecasts had more forecasts below the observed extent. The dynamical methods performed better as the lead time decreased, having the smallest forecast error in August. The statistical methods had the smallest error in July.
Section 4b. Review of Statistical Methods
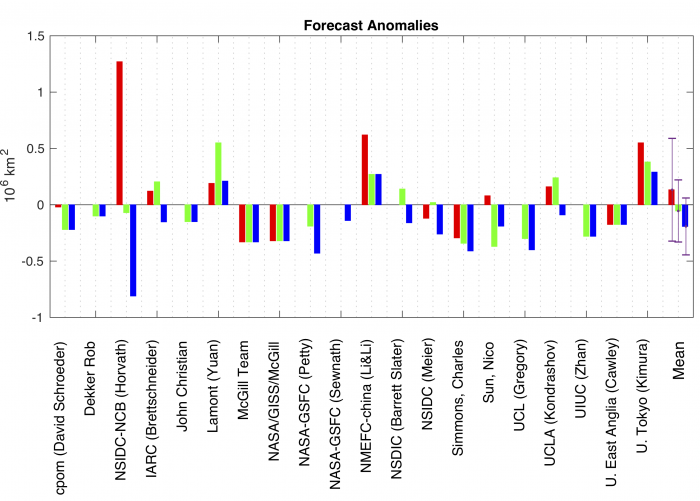
The mean September sea-ice extent (SIE) predicted by statistical models was 4.44, 4.26, and 4.13 million square kilometers, respectively for the June, July, and August forecasts. Fifty-two September SIE predictions from 20 statistical models were submitted in the 2019 summer season: 13 in June, 19 in July, and 20 in August, respectively. Out of the 52 predictions, 16 remained unchanged through the season (i.e., the August forecast was the same as the corresponding June and July forecasts). The standard deviation of the 52 predictions was 0.34 million square kilometers with a mean error of -0.04 million square kilometers. The individual model input from each month is summarized in Figure 4a-3 (pink section) and is shown in Figure 4b-1 as errors relative to observed extent. Overall, statistical models tended to underpredict September sea ice extent, and both the July (green) and August (blue) mean forecasts had negative forecast errors (green and blues bars in the last two columns), while the June forecast (red) ended with positive errors. Although the mean anomalies tend to be very small, the spread is considerable, shown by the standard deviation of the three month's forecast: 0.46, 0.28, and 0.25 million square kilometers, respectively. Nevertheless, this spread is smaller than the spread among dynamical models described above.
Out of the 20 statistical models, three (NSIDC-CU-Boulder; Lamont [Yuan]; and Sun, Nico) also provided a spatial sea-ice probability forecast, their contribution is summarized in the following section, together with other dynamical models.
Statistical methods included linear models, nonlinear models, and one probability model. Statistical models have two characteristics that are fundamentally different from dynamic models. First, they can be developed with a single time series of sea ice extent without requiring the spatial information on ice concentration. Second, they rely on statistical relationships that can be built using monthly or yearly time series. These two characteristics give statistical models tremendous advantage in terms of computing resource demands, compared to dynamic models. Compared to predictions from other methods submitted to our monthly SIO in 2019, the forecasted September sea ice extent from these statistical models actually had the least spread in all three months.
Section 4c. Review of Dynamical Models and Methods of Forecast Initialization
The mean September sea-ice extent forecast from all dynamical models was 4.51±+/-0.59 million square kilometers. As shown in Figure 4a-2 above, forecasted September extents decreased from June to August (mean dynamical model forecasts of 4.73±+/-0.57, 4.52±+/-0.59, and 4.34±+/-0.58 million square kilometers in June, July, and August respectively), thus the model-mean forecast improved with shorter lead time (observed extent = 4.32), yet the model forecast spread was unchanged throughout the summer (i.e., forecasts did not converge with shortening lead time as one would expect). The 2019 SIO forecasts from dynamical models were assessed based on their forecast initialization of sea-ice concentration and sea-ice thickness observations. Figure 4c-1shows the September extent forecasts through the summer from the models grouped by initialization: models that do not assimilate either extent or thickness, models that only assimilate concentration, and models that assimilate both concentration and thickness.
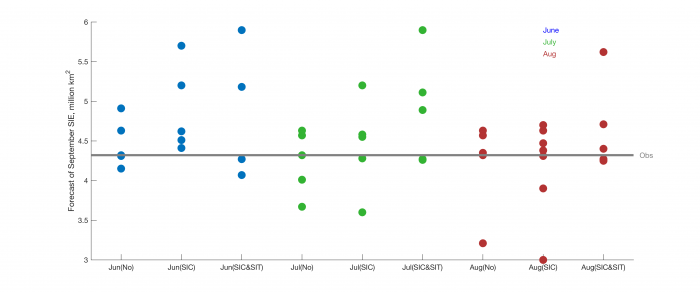
The mean extent across all summer forecasts was 4.30±0.42 million square kilometers (no assimilation), 4.47±+/-0.61 million square kilometers (SIC assimilation), and 4.79±0.65 million square kilometers (SIC and SIT assimilation). While this is a small sample size, it is interesting that the forecast spread among models that assimilate either ice concentration or concentration and thickness tends to be larger than the spread among models that assimilate neither.
Section 4d. Spatial Forecasts of September Sea Ice Extent Probability (SIP)
As practiced since 2014, participants were invited to submit forecasts of sea-ice extent probability (SIP – forecast probability of concentration greater than 15%). This year we received a total of 36 probability forecasts: 12 in June, 12 in July, and 12 in August. This equals the record high number of forecasts collected in 2018. Figure 4d-1 shows the probability forecasts from June 2019, and the model mean probability forecasts for June, July, and August.
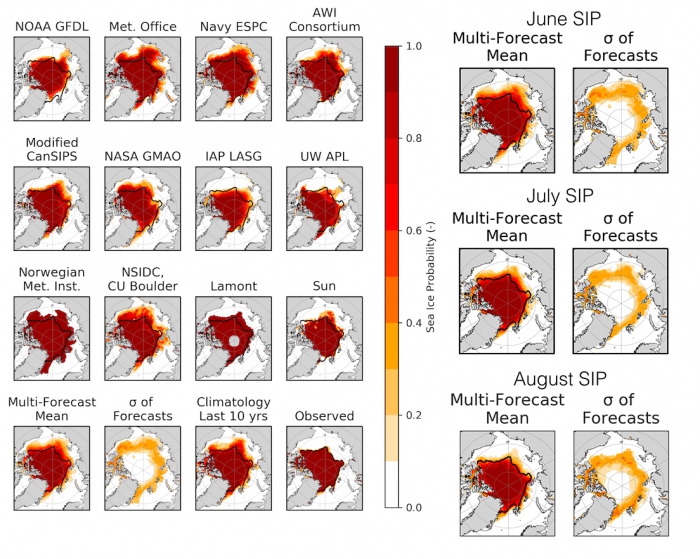
Comparing the right hand panels reveals that the reduction in model-mean extent forecasts in Figure 4d-1 throughout the summer was mainly a result of reduced forecasted sea ice concentration (and hence SIP) along the East Siberian-Chukchi-Beaufort regions, while forecasts of sea ice west of 90 degrees E (Kara/Barents/East Greenland) did not change much through the summer.
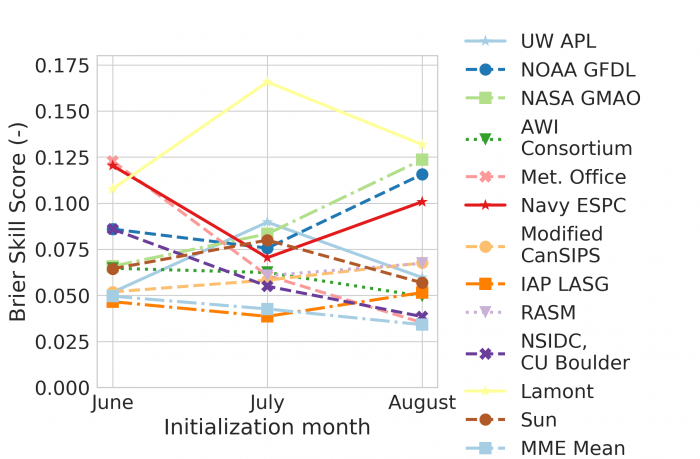
To further quantify how forecast skill evolved from June to August initializations, Figure 4d-2 shows the spatial mean Brier scores for all model submissions and that of the model mean ice probability from June to August. Several interesting features arise. Notably, there is an improvement in the multi-model forecast skill (MME mean) from June to August, and this forecast is in the top two for skill (a similar feature is seen in past years). However, individual model skill does not always improve with lead time, and the spread in skill also does not reduce with shortening lead times as might be expected.
Section 4e. Review of Regional Alaska Forecasts
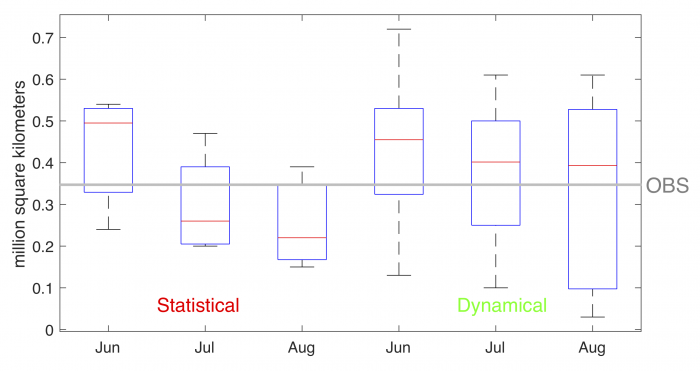
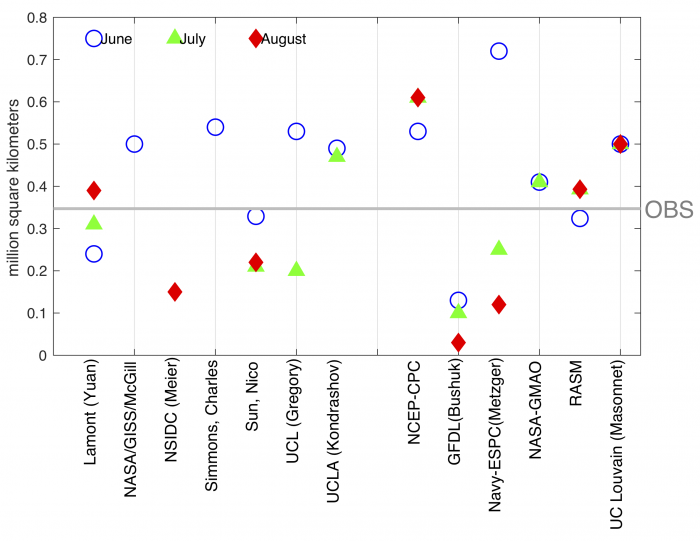
This year we again invited participants to submit forecasts of sea ice extent for the Alaskan region, defined as the combination of the Bering, Chukchi, and Beaufort seas. We received 12 forecasts in June, 10 in July, and 8 in August. Among these, 13 forecast inputs were based on statistical methods, and another 17 were based on dynamical models. The mean forecasted value for the Alaskan Arctic was 0.36 million square kilometers with a standard deviation of 0.17 million square kilometers. The observed 2019 September extent in the Alaskan region was 0.35 million square kilometers according to NSIDC, mainly due to extremely low sea cover in the Chukchi Sea. Sea-ice extent in the Chukchi Sea in 2019 was the lowest in the satellite era for March and for May through August, and second lowest in April. However, September was ranked as the 5th lowest. The 2019 value is significantly lower compared with the value of 2018 (0.56 million square kilometers).
With limited number of inputs, the dynamic models on average showed higher ice extent compared with observations—this is the opposite of their 2018 forecast, in which the median of the dynamic models under-predicted Alaskan sea-ice extent. The statistical models had lower ice extent in their July and August forecast, but higher extent in their June forecast.
Hudson Bay Region
Forecasts for Hudson Bay were solicited for the first time this year and we received six in each of the months of June, July and August. Hudson Bay is particularly relevant for understanding pan-Arctic sea ice retreat and ice advance periods. Information about the 2019 summer season can be found in the Regional Sea Ice Extent Discussion sections in the June, July and August 2019 SIO reports.
Section 5. Further Analysis of the Sea Ice Outlooks
Section 5a: Probabilistic Assessment of the 2008-2019 Outlooks: Comparison between SIO Contributions and Control Forecasts
A key issue with regard to the SIO forecasts is their skill relative to simpler control forecasts. A compilation of SIO results from 2008 to 2018 enabled a quantitative comparison of the skill of the SIO forecasts against persistence-based forecasts. In this case, persistence was evaluated from the mean ice extents in the National Snow and Ice Data Center's Sea Ice Index. The median absolute error of the all-forecaster average SIO outlooks issued in July of 2008–2018 was 0.32 million square kilometers, while the corresponding median absolute error of forecasts of persistence of the departure from the trend line of the pan-Arctic ice extents of May, June, July, and August were 0.43, 0.22, 0.25, and 0.09 million square kilometers. Thus, the SIO forecasts issued in July of 2008-2018 outperformed the trend-line anomaly persistence forecasts from May, but not from June, July, or August. Persistence of the previous September's deviation from the trend line had a median absolute error of 0.37 million km2, while simple persistence of the previous year's actual value has an error of 0.40 million square kilometers. The corresponding root-mean-square errors (in millions of square kilometers) are 0.57 for SIO; 0.67, 0.46. 0.42, and 0.18 for persistence of the trend-line departures of May, June, July, and August; 0.68 for persistence of the trend-line departure from the previous September; and 0.67 for persistence of the actual extent from the preceding September. The relative skill levels of the trend-line-departure forecasts and the SIO forecasts are similar when the metric is the median absolute error over the 2008-2018 period as shown in Figure 5a-1, which compares the June SIO median forecasts with the persistence-from–trend forecasts. The SIO forecasts used in this comparison were averages of all forecasts submitted to the SIO, so it is quite possible that some individual forecasts were considerably better. Nevertheless, it is apparent that sea ice anomaly persistence has historically been a challenging control forecast and a respectable competitor for forecasts issued by the scientific community.
With this background, we can evaluate the 2019 SIO outlooks relative to the benchmark forecasts. The 2019 SIO median forecasts issued in June, July, and August were 4.40, 4.28 and 4.22 million square kilometers, respectively, corresponding to errors (relative to the observed 4.32 million square kilometers) of +0.08, -0.04, and -0.10 million square kilometers. The persistence forecast based on the 2018 mean September extent was 4.71 million square kilometers, for which the error was 0.39 million square kilometers. The linear trend line forecast of 4.37 million square kilometers had an error of +0.05 million square kilometers. The forecast based on persistence of the 2018 departure from the trend line was 4.63 million square kilometers, corresponding to an error of +0.31 million square kilometers. Considering the various benchmarks, only the forecast of the linear trend line value was comparable in accuracy to the SIO median forecasts in 2019. In this case, despite the historical superiority of the departure from the trend line as illustrated in Figure 5a-1, the persistence of the 2018 departure from the trend line was outperformed by not only the SIO median but by the majority of the individual SIO submissions of June, July and August.
Predictand: September pan-Arctic Ice Extent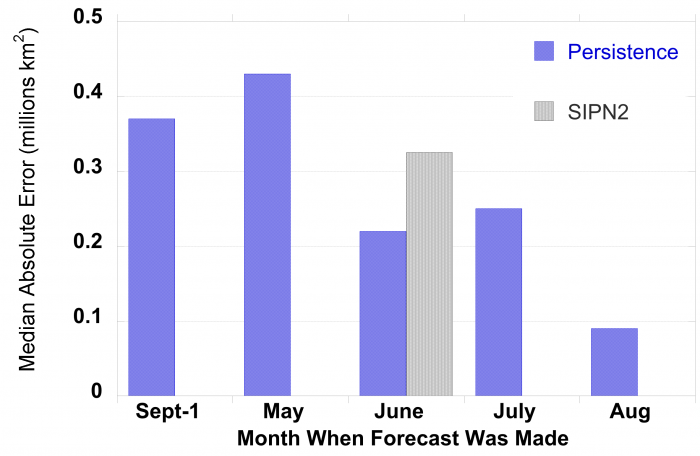
Section 5b: Evaluation of SIO Forecast Skill Relative to Control Forecasts
Those years in which unusual weather conditions caused a sharp departure in sea ice extent compared with the previous year are also the years when SIO prediction errors are large. Figure 5b plots SIO ensemble errors, defined as observed September sea ice extent minus the median July SIO prediction, against the change in observed extent compared with the previous year. When there is a large change in sea ice extent compared with the previous year, the median SIO predictions are likely to be far off as well, and in the same direction. Change from the previous year explains 85% of the variance in SIO median errors.
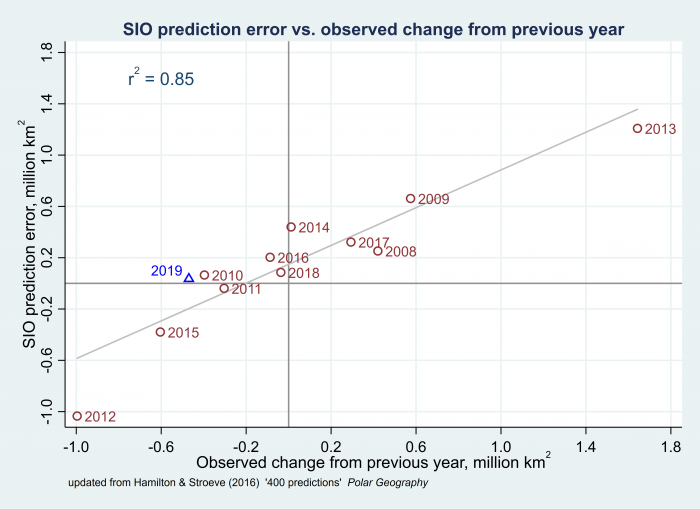
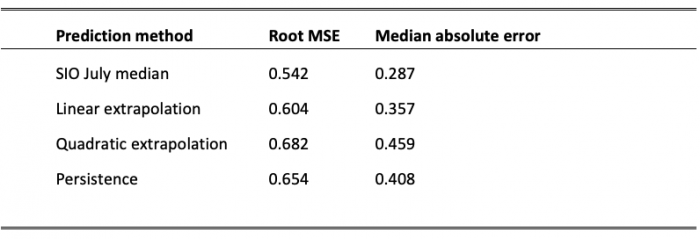
The strong correlation (Figure 5b) suggests that expecting "persistence," or guessing that this year's ice extent will be the same as last year's, might yield predictions competitive with the median SIO. An alternative, climatological null hypothesis could use predictions from either linear or quadratic extrapolation, representing the overall trends to that date. Table 5b compares the accuracy of median SIO predictions with these other strategies in terms of their root mean squared errors (MSE), or their more outlier-resistant median absolute errors. By either criterion, over the period 2008–2019, the median of July SIO predictions performed better than guessing the previous year's value, and performed better than extrapolating the downward trend (whether linear or quadratic) up to but not including each year.
The root MSE and median absolute errors shown in the table are in millions of square kilometers. Thus, taking the July SIO median as our prediction each year yields a median absolute error of 287,000 square kilometers. Although lower than the median absolute errors from linear extrapolation (357,000 square kilometers), quadratic extrapolation (459,000 square kilometers) or persistence (408,000 square kilometers), that still leaves much room for improvement in predicting the interannual variations of sea ice extent.
Section 6. Antarctic Contributions
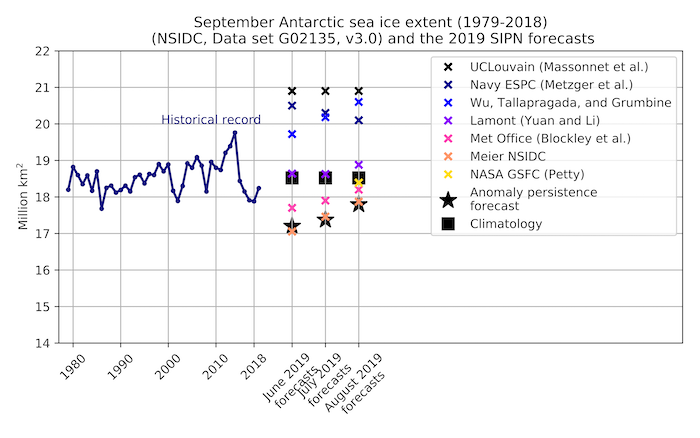
Since 2017 the Sea Ice Outlook has accepted Antarctic contributions, expressed as a pan-Antarctic September sea ice extent forecast. September is the month of maximum sea ice extent according to observations, and the climatological mean (1979-2018) for that month is 18.52 million square kilometers, according to the NSIDC G02135 Sea Ice Index. In 2019, sea ice extent reached 18.24 million square kilometers in September, which is the 13th lowest out of 41 years and 0.28 million square kilometers below climatology.
We received contributions from seven groups. Three followed a statistical approach (Lamont, Meier NSIDC, NASA GSFC) and four followed a dynamical model-based approach (UCLouvain, Navy ESPC, Wu et al., Met Office). These groups are also regular contributors to the SIPN South activity, which aims at collecting summer Antarctic forecasts. Initial analyses conducted in the framework of SIPN South indicate that while forecasts of pan-Antarctic extent are in reasonable agreement with the observations, regional errors exist. It is furthermore unclear at this stage if SIPN South forecasts beat a simple climatological forecast.
Figure 6-1 shows the Sea Ice Outlook forecasts for September 2019 as submitted in June, July and August 2019, together with the contextual historical time series and the value for 2019 (18.24 million square kilometers according to NSIDC Sea Ice Index). There are several interesting points, in particular because they were already raised over the past two years:
The forecast ensemble range exceeds the observed historical range by a factor of two. This was already the case in previous Sea Ice Outlook reports. The large range results from the combination of two factors: three dynamical model contributions forecasting overly high sea ice extent, and two statistical contributions forecasting low sea ice extent. Regarding dynamical model contributions, a similar result was found in the SIPN South summer forecasts and this seems to be related to initialization issues. Regarding statistical model contributions, forecasts for 2019 were tracking low in April and May, but then observed sea ice grew quickly until September. This can help explain why two of the three statistical methods forecasted record low sea ice extent in their June submissions.
The Met Office (dynamical model) contribution not only provided a better forecast than other dynamical contributions, it was also able to integrate information better as time advanced. The other dynamical contributions either update the forecasts in the wrong direction, or with not enough change. (Note that the UCLouvain is a mere repetition of the forecast submitted in June).
Similar to SIPN South findings, statistical approaches appear in general to provide better skill than dynamical models for pan-Antarctic sea ice extent. This statement might not hold at the regional scale, and needs to be verified with predictions from at least several more years.
Section 7. Sea Ice Drift Forecast Experiment (SIDFEx) Results
The year 2019 was the third year of the Sea Ice Drift Forecast Experiment (SIDFEx), a contribution to the Year of Polar Prediction (YOPP). SIDFEx is a community effort to collect and analyze Arctic sea ice drift forecasts at lead times from days to a year, based on various methods, for a number of buoys and other objects drifting with the ice. Since October 2019, SIDFEx has also been providing real-time consensus forecasts for the MOSAiC drift campaign. Here we only consider the seasonal buoy drift forecasts aligned with the 2019 Sea Ice Outlook, in continuation of the SIDFEx analysis presented in the 2018 Sea Ice Outlook Post-Season report.
Six of the thirteen groups contributing to SIDFEx have submitted seasonal drift forecasts for Arctic buoys aligned with the SIO 2019 (i.e., SIDFEx forecasts for these groups were based on the same model runs as used for the SIO contributions). Five of these are directly linked with SIO dynamical-model forecasts described above, namely AWI (past_forced = Kauker et al.), NavyESPC (US Navy, Metzger et al.), ECMWF (SEAS5), UCL (UC Louvain, Massonnet et al.), and UW (Zhang and Schweiger). The AWI (sat_past) product comprises ten-member ensembles that are based on satellite-derived drift fields of the previous 10 years and can thus be regarded as a climatological reference forecast.
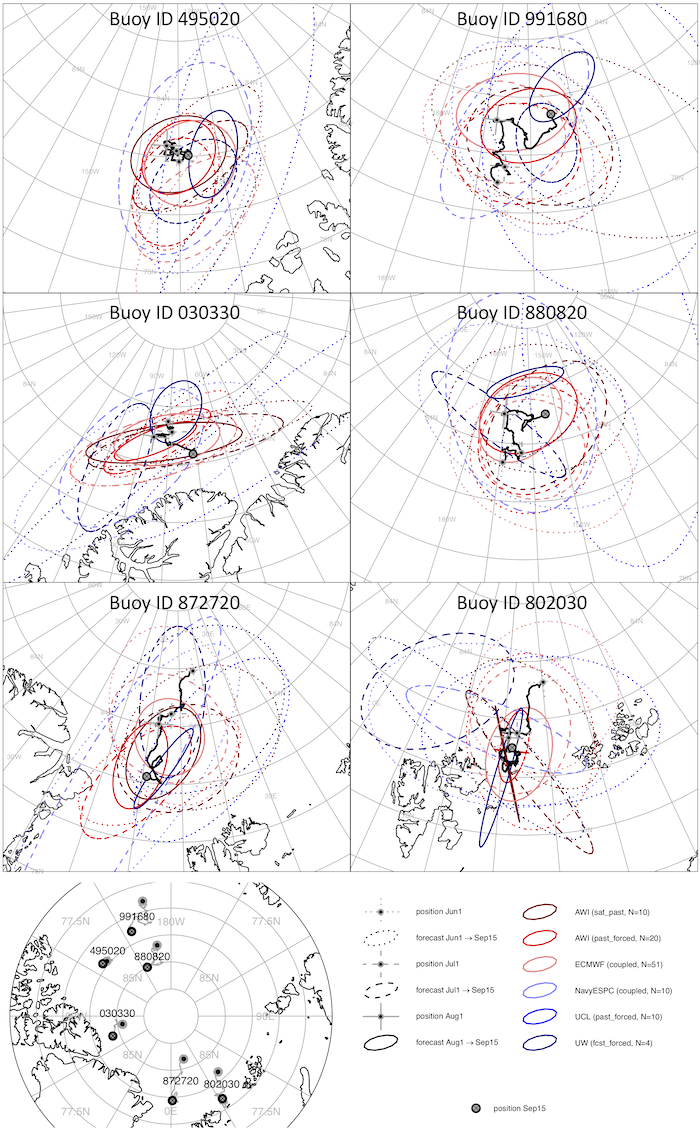
The analyses presented in previous post-season reports considered only two (2017) and three (2018) buoys, whereas this time we can analyze forecasts for six SIDFEx-targeted buoys that stayed in the ice cover and continuously provided data from 1 June through 15 September (Fig. 7-1, bottom left). Consistent with unusually strong ice drift from the Pacific to the Atlantic sector associated with a predominantly negative phase of the Arctic dipole pattern (see Section 3d), four of the buoys (991680, 880820, 872720, 802030) drifted considerable distances (up to 450 km) along the Transpolar Drift Stream; one of these (802030) ended up close to the 15 September ice edge east of Svalbard. In contrast, the buoy north of the Canadian Arctic Archipelago (495020) remained within 60 km of its initial (1 June) position. Despite the increased number of buoys, the analysis remains largely qualitative.
We depicted and evaluated the forecasts based on ellipses obtained by "spatial dressing" the forecast ensembles (Figure 7-1). As expected, spatial uncertainty in the position forecasts for 15 September tends to decrease as the initial time approaches the target time for all buoys. Forecast ellipses for the buoys closer to Canada and Greenland (495020 and 030330) tend to be more eccentric, with their main axis parallel to the coast. The way the ellipses are constructed, the forecasts are reliable when the corresponding ellipses contain the verifying observed position in approximately 90% of all cases. Combining all initial dates and forecast systems, hit ratios range from around 70% for the two buoys close to Canada and Greenland to around 90% for the remaining buoys. This spatial gradient of forecast reliability is consistent with remaining challenges sea-ice models are facing in situations where ice motion is strongly influenced by internal ice stresses. Although these results are an improvement relative to 2018, where the forecasts for two out of three buoys exhibited overall hit ratios below 40%, this increase is likely more a result of the less anomalous drift pattern rather than improvements in forecast systems.
The limited effective sample size still prevents a meaningful ranking of the different models/methods, to draw conclusions related to methodological differences, or to track down model errors. A SIDFEx community paper that will provide more detailed analyses for all years, targets, forecast methods, and time scales is planned to be published later in 2020.
Section 8. Sea Ice Forecasts for Alaska Marine Shipping Industry
The Bering Sea crab fleet makes a significant contribution to the economic well-being of the State of Alaska and communities in the Bering Sea and Aleutian Islands region (BSAI). Recent estimates indicate that, in terms of ex-vessel value, the harvest of Bering Sea crab was worth approximately $230 million in 2015. (The ex-vessel value is the post-season adjusted price per pound for the first purchase of commercial harvest.) Access to the fishery is gained through the purchase or lease of a quota share. Approximately 90 vessels operate in the Bering Sea crab fishery, representing roughly 500 crab quota shareholders (BSFRF 2020). Crabbing is a dangerous occupation. Participants face a number of risks including winter storms and vessel icing. Along with these challenges, the fishing season for key species such as Snow Crab occurs during the later months of winter and early months of spring when sea ice is typically at its maximum extent. As a consequence, members of the fishery must be mindful and plan for the likelihood of encountering sea ice during harvest operations. To date little attention has been devoted to evaluating how seasonal sea ice forecast might serve to support the safety of fishing operations. An online survey is being used to identify what role seasonal sea ice forecasts can play in supporting safe crab fishing operations.
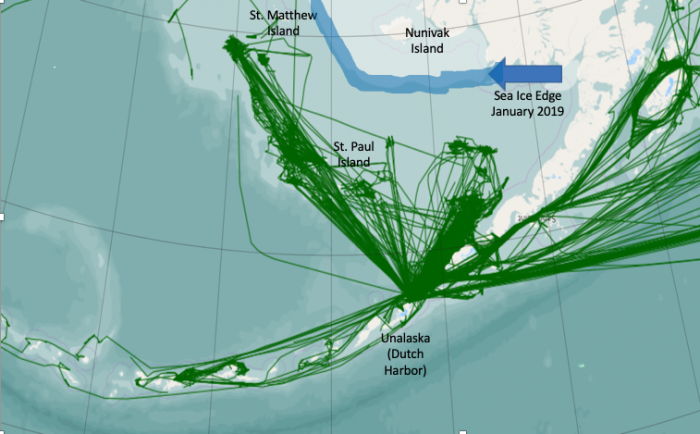
The online survey has been developed in collaboration with representatives from the Bering Sea crab organization. The principal collaborator who reviewed questions and suggested revisions has over 26 years of experience working in the Bering Sea running a crab boat and continues as an active member of the community. Initial design of the questions occurred through Spring of 2019, refinement and revision, and testing was completed in the autumn of 2019. A key insight shared during the development process is that sea ice can present a significant challenge to logistics and supply efforts of fleet members. The survey is now active online. A weblink to the survey has been provided to participants through an industry newsletter and organizational email list serve. The survey will run through the middle of March 2020. Preliminary findings will be presented during a poster session at the 2020 Climate Variability and Predictability Program (CLIVAR) workshop and via the SIPN2 mailing list.
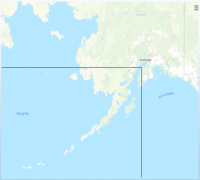
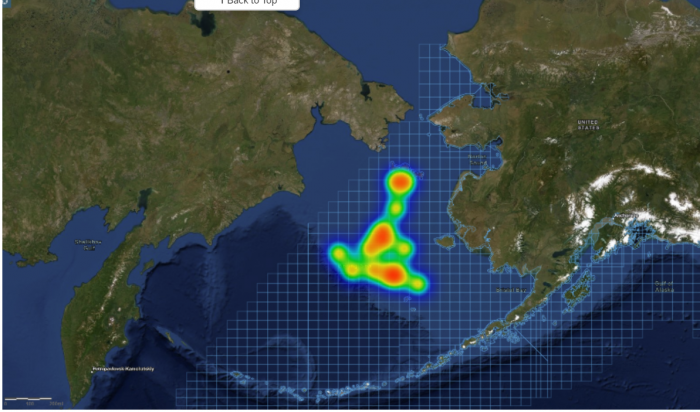
Broken down into three sections, the survey seeks to assess prior experience with and perceptions of sea ice in the Bering Sea, how sea ice can and has impacted operations, and how fishery participants utilize synoptic sea ice forecasts provided by the National Weather Service. The survey gauges potential interest in utilizing seasonal scale sea ice forecasts; uses heat mapping (Figure 8a2) to identify preferred locations where seasonal scale forecasts would be most useful; and asks fishery participants to rank, in order of priority, which months they would like to have a seasonal scale forecast. (Heatmaps use color-coding to graphically represent user behavior on specific webpages or webpage templates.) For ease of use the survey is compatible with handheld devices. Seasonal scale sea ice forecasts can potentially help address a number of key challenges which impact fleet logistics and operations. Based on input provided by our collaborating partner, sea ice events can limit access to the harbor at St. Paul Island during critical harvest periods. St. Paul Island serves as a location for resupply and harvest delivery. Restricted access to the port impacts fleet logistics and can increase operations costs of fishery participants.
References
Bering Sea Fisheries Research Foundation (BSFRF). Accessed at: http://www.bsfrf.org/crab_fish.php
Cavalieri, D. J., C. L. Parkinson, P. Gloersen, and H. J. Zwally. 1996, updated yearly. Sea Ice Concentrations from Nimbus-7 SMMR and DMSP SSM/I-SSMIS Passive Microwave Data, Version 1. Boulder, Colorado USA. NASA National Snow and Ice Data Center Distributed Active Archive Center. doi: https://doi.org/10.5067/8GQ8LZQVL0VL.
McDowell Group (2017). The Economic Value of Alaska’s Seafood Industry. https://www.mcdowellgroup.net/wp-content/uploads/2017/10/ak-seadfood-im…
Section 3b: Ocean Heat Conditions
Banzon, V., Smith, T. M., Chin, T. M., Liu, C., and Hankins, W., 2016: A long-term record of blended satellite and in situ sea-surface temperature for climate monitoring, modeling and environmental studies. Earth Syst. Sci. Data, 8, 165–176, doi:10.5194/essd-8-165-2016.
Maslanik, J. and J. Stroeve, 1999. Near-Real-Time DMSP SSMIS Daily Polar Gridded Sea Ice Concentrations, Version 1. Boulder, Colorado USA. NASA National Snow and Ice Data Center Distributed Active Archive Center. doi: https://doi.org/10.5067/U8C09DWVX9LM.
Steele, M., and Dickinson, S. ( 2016), The phenology of Arctic Ocean surface warming, J. Geophys. Res. Oceans, 121, 6847– 6861, doi:10.1002/2016JC012089.
Section 3c: Discussion of 2019 Fall Ice Advance
NSIDC, December 2019: Arctic Sea Ice News and Analysis: That’s a wrap: A look back at 2019 and the past decade. Online resource: http://nsidc.org/arcticseaicenews/2020/01/thats-a-wrap-a-look-back-at-2… (visited 27 January 2020).
D. Perovich, W. Meier, M. Tschudi, S. Farrell, S. Hendricks, S. Gerland, L. Kaleschke, R. Ricker, X. Tian-Kunze, M. Webster, and K. Wood, 2019: Sea Ice in Arctic Report Card 2019. Online resource: https://arctic.noaa.gov/Report-Card/Report-Card-2019 (visited 27 January 2020).
Fetterer, F., K. Knowles, W. N. Meier, M. Savoie, and A. K. Windnagel. 2017, updated daily. Sea Ice Index, Version 3. Boulder, Colorado USA. NSIDC: National Snow and Ice Data Center. doi: https://doi.org/10.7265/N5K072F8.
Report Credits
This 2019 Sea Ice Outlook Full Post-Season Report was developed by the SIPN2 Leadership Team with contributions from community partners.
Report Lead:
Uma Bhatt, University of Alaska Fairbanks, Geophysical Institute
Additional Contributors:
Peter Bieniek, University of Alaska Fairbanks, International Arctic Research Center
Cecilia Bitz, University of Washington, Program on Climate Change
Edward Blanchard-Wrigglesworth, University of Washington, Department of Atmospheric Sciences
Hajo Eicken, University of Alaska Fairbanks, International Arctic Research Center
Helge Goessling, Alfred-Wegener Institute, Helmholtz Centre for Polar and Marine Research
Larry Hamilton, University of New Hampshire, Carsey School of Public Policy
Joseph Little, University of Alaska Fairbanks, School of Management
François Massonnet, Université Catholique de Louvain (Belgium)
Walt Meier, National Snow and Ice Data Center
James Overland, NOAA, Pacific Marine Environmental Laboratory
Mark Serreze, University of Colorado Boulder, NSIDC
Michael Steele, University of Washington, Applied Physics Laboratory
Julienne Stroeve, University College London, National Snow and Ice Data Center
Rick Thoman, University of Alaska Fairbanks
Molly Hardman, NSIDC
John Walsh, International Arctic Research Center, University of Alaska Fairbanks
Muyin Wang, NOAA and the Joint Institute for the Study of the Atmosphere at the University of Washington
Helen Wiggins, Arctic Research Consortium of the U.S.
Kevin R. Wood, Research Scientist, University of Washington, Joint Institute for the Study of the Atmosphere and Ocean (JISAO), and NOAA Pacific Marine Environmental Laboratory
Editors:
Betsy Turner-Bogren, ARCUS
Helen Wiggins ARCUS
Suggested Citation:
Bhatt, U. S., P. Bieniek, C Bitz, E. Blanchard-Wrigglesworth, H. Eicken, H. Goessling, L. C. Hamilton, M. Hardman, J. Little, F. Massonnet, W. Meier, J. E. Overland, M. Serreze, M. Steele, J. Stroeve, R. Thoman, J. Walsh, M. Wang, H. V. Wiggins, and K. Wood. Editors: Turner-Bogren, B. and H. V. Wiggins. February 2020. "2019 Sea Ice Outlook Full Post-Season Report." (Published online at: https://www.arcus.org/sipn/sea-ice-outlook/2019/post-season.)
This Sea Ice Outlook Report is a product of the Sea Ice Prediction Network–Phase 2 (SIPN2), which is supported in part by the National Science Foundation under Grant No. OPP-1748308. Any opinions, findings, and conclusions or recommendations expressed in this material are those of the author(s) and do not necessarily reflect the views of the National Science Foundation.


