Outlook Report
Executive Summary
Thank you to the groups that contributed to this 2019 July Sea Ice Outlook (SIO) report. We received 39 contributions that include pan-Arctic predictions, which is tied with the record number of contributions received for the Sea Ice Outlook. Combined with the contributions to the 2019 June SIO report, we have received a total of 70 contributions this season. We also received two new Antarctic contributions, for a total of 8 for June and July, and 10 additional Alaska contributions in July for a total of 19 so far.
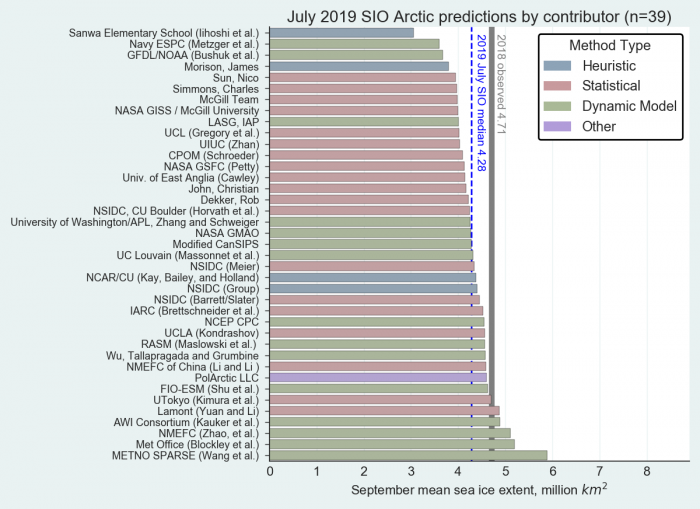
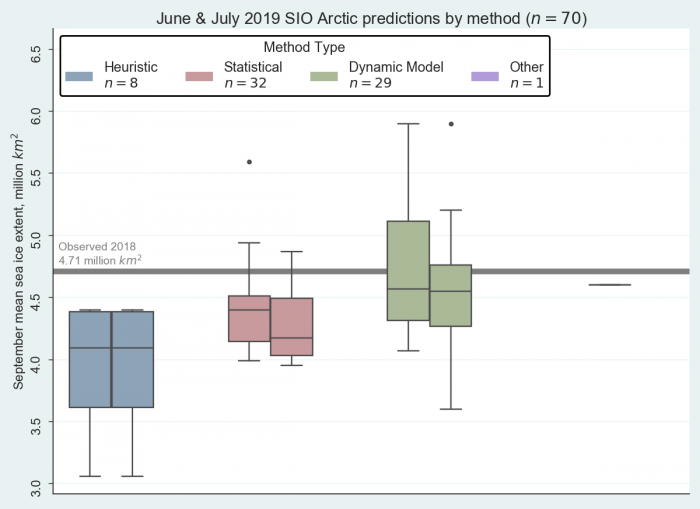
The projected median Arctic September extent from all contributions is 4.28 million square kilometers, with a quartile range of 4.0 to 4.6 million square kilometers. This is a slight drop from the June median Outlook of 4.4 million square kilometers, which is not surprising given the relatively rapid decline in ice extent during June. The change from June to July was almost exclusively due to a drop in the extent of the statistical contributions; the median of model and heuristic contributions changed very little. One contribution projects a new record low extent of 3.06 million square kilometers, while the highest projection is nearly six million square kilometers. The model contributions projected higher extent, on average, than the statistical and heuristic methods, which was also the case for June 2019 submissions and throughout the 2018 season. The range in the model projections is also larger than the other two methods
Projected fields of Sea Ice Probability (SIP) are similar to those for June, but with slightly lower values around the marginal ice zone. The Northeast Passage (Northern Sea Route) is forecast to be open ocean (SIP<10%) in September. However, there is significant forecast uncertainty (a large spread in projections) in the timing of ice retreat (the Ice Free Date, or IFD) along the marginal sea ice zone. Contributions to the 2019 SIPN/Year of Polar Prediction community forecast experiment, the Sea Ice Drift Forecast Experiment (SIDFEx), are still coming in and will be discussed in a future report when results are available.
With respect to current conditions as of the publication of this report, total Arctic extent was tracking below levels recorded in 2012, the year that ended up with the lowest September extent on record. Extent is far below normal in the Beaufort and Chukchi seas and along most of the Eurasian coast. The Northern Sea Route appears to be mostly open. This report also includes sections on regional sea-ice conditions and Antarctic sea-ice extent.
The July report is the product of the Sea Ice Prediction Network - Phase 2 (SIPN2) effort. The goal of the previous SIPN1 was to enhance scientific discussion on the physics that control summer sea-ice extent. SIPN2 goes deeper into quantitative comparisons of model forecast output. For the second year, all participants whose methods provided information at the local scale were encouraged to provide full spatial fields via the SIPN Data Portal for computation of metrics such as sea ice probability (SIP) and first ice-free date (IFD), as well as additional regional analyses.
This July Outlook was developed by lead authors Mark Serreze (NSIDC), Walt Meier (NSIDC), and Julienne Stroeve (NSIDC, UCL, University of Manitoba). Additional contributors include: Edward Blanchard-Wrigglesworth and Cecilia Bitz, University of Washington (discussion on predicted spatial fields); Michael Steele, University of Washington (discussion of ocean heat); Uma Bhatt, John Walsh, and Rick Thoman, University of Alaska Fairbanks (discussion of ice conditions in the Bering and Chukchi seas); Julienne Stroeve, University of Manitoba (discussion of ice conditions in the Hudson Bay region); Francois Massonnet, Université catholique de Louvain (discussion of Antarctic contributions); Molly Hardman, NSIDC (statistics and graphs); Betsy Turner-Bogren, Helen Wiggins, Stacey Stoudt, and Lisa Sheffield Guy, ARCUS (report coordination and editing); and the rest of the SIPN2 Project Team.
Note: The Sea Ice Outlook provides an open process for those interested in Arctic sea ice to share predictions and ideas; the Outlook is not an operational forecast.
Overview
The median July Outlook value for a September 2019 sea-ice extent is 4.28 million square kilometers with quartiles of 4.0 and 4.6 million square kilometers (Figure 1). Of the 39 July 2019 SIO contributions, 15 are based on dynamical models, 19 are based on statistical methods, 4 are based on heuristic approaches (qualitative analyses), and one used artificial intelligence. Projected extents are slightly lower compared to the 2019 June outlook (4.40 million square km), due almost totally from a drop in statistical projections, which likely reflects the fairly rapid ice loss in June. The July 2019 outlook values are also lower than July 2018 (4.70 million square kilometers) and July 2017 (4.50 million square kilometers). The projections range from 3.06 to 5.90 million square kilometers, which is greater than the range in 2018 and 2017. Only one projection is for a new record low (below the mark of 3.60 set in 2012), but three more projections are for a sea-ice minimum below four million square kilometers. The median value of the projected September sea-ice extent roughly follows the linear trend line for the 1979 to 2018 observations.
Similar to results summarized in the June 2019 report, and as in previous years, the spread in projections from the dynamical models is larger compared to the statistical models (Figure 2). Overall, the heuristic method has the lowest projected September sea-ice extent value with a median of 4.09 million square kilometers, and dynamical models have the highest median of 4.56 million square kilometers. The statistical methods have a median of 4.2 million square kilometers.
Predictions from Spatial Field (SIP and IFD)
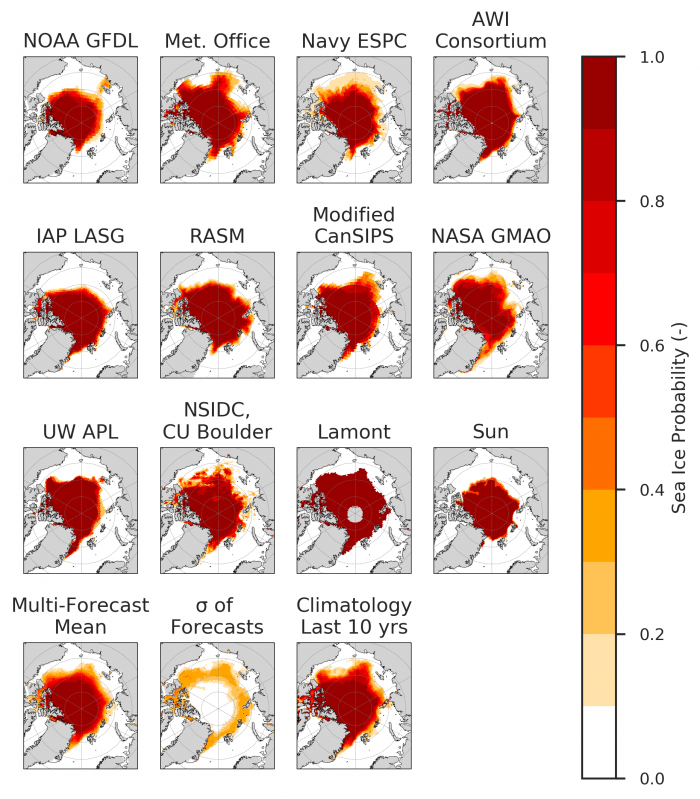
Sea-ice probability (SIP) is defined as the fraction of ensemble members in an ensemble forecast with September ice concentration in excess of 15%. First ice-free date (IFD) is the first date in the melt season at which the ice concentration at a given location drops below 15%.
For the July SIO, we received 12 submissions of SIP (nine dynamical, three statistical) and eight submissions of IFD (seven dynamical, ine statistical). We typically have fewer estimates of IFD because daily Sea Ice Concentration (SIC) forecasts are needed, yet some participants only provide monthly SIC forecasts. We show SIP forecasts in Figure 3 and IFD forecasts in Figure 4.
The patterns of SIP forecasts are similar to those for June, but with slightly lower values around the marginal ice zone, with many models forecasting a slightly more northward sea ice edge with respect to their June forecasts, perhaps illustrating the impact of a warm June. The Northeast Passage is forecast to be open ocean (SIP < 10%). Once again, model uncertainty is especially marked in the Beaufort/Chukchi/East Siberian seas. Interestingly, the model mean SIP forecast is close to a climatology forecast that uses the last 10 years of September sea ice cover as predictors.
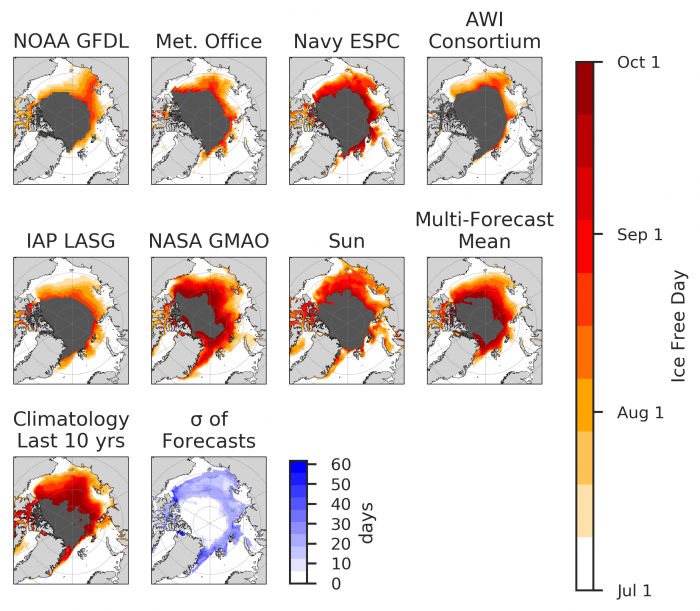
Turning attention to forecasts of IFD, there is significant forecast uncertainty in the timing of ice retreat along the marginal sea ice zone, where forecast uncertainty is typically one month. This forecast uncertainty is noteworthy even across models that forecast a similar SIP in Figure 3. For example, AWI and NAVY ESPC diverge in about a month in their IFD forecasts along the Laptev/East Siberian/Chukchi seas.
Current Conditions
During June and through mid-July, Arctic sea ice extent has been tracking at record or near-record low daily levels. Since 10 July up to the release of the present report, sea ice extent has tracked consistently below levels observed in 2012, the year which ended up with the lowest September extent in the satellite record. During June, most ice loss was in Hudson Bay and in the Kara Sea. During the first half of July, sea ice retreated everywhere around the Arctic Ocean (except north of the Canadian Arctic Archipelago) and by mid-July nearly all of the ice had melted out in Hudson Bay. As of 18 July, sea ice extent was below the 1981-2010 average everywhere except within the East Greenland Sea, around Svalbard, and within the East Siberian Sea.
July is typically the warmest month in the Arctic and the month with the fastest rate of ice loss. May 2019 was the warmest May on record in the Arctic according to output from the NCEP/NCAR data, and June was the second warmest. Over the first half of the month, July air temperatures were above average everywhere except within the Laptev Sea.
So far this summer, the atmospheric pattern has been one of high sea level pressure over the Arctic Ocean and low pressure over Eurasia, a pattern known to favor summer ice loss and broadly consistent with the warm conditions that have been observed. This has been in contrast to the past several summers, when cyclonic conditions prevailed over the central Arctic Ocean. However, as of this report, a more cyclonic pattern has started to develop. Whether this will persist remains to be seen.
Melt onset, as assessed from satellite passive microwave data, was particularly early this summer within the northern Bering Sea, the Chukchi Sea, and the Southern Beaufort Sea where melt began 30 to 40+ days earlier than average (Figure 5). Melt was also considerably earlier than average in Baffin Bay, the Sea of Okhotsk, and the outer edge of the East Greenland Sea. There was moderately earlier melt onset (10 days earlier) in parts of Hudson Bay, the Lincoln Sea, and the northern parts of the East Siberian and Laptev seas and the southern Kara Sea.
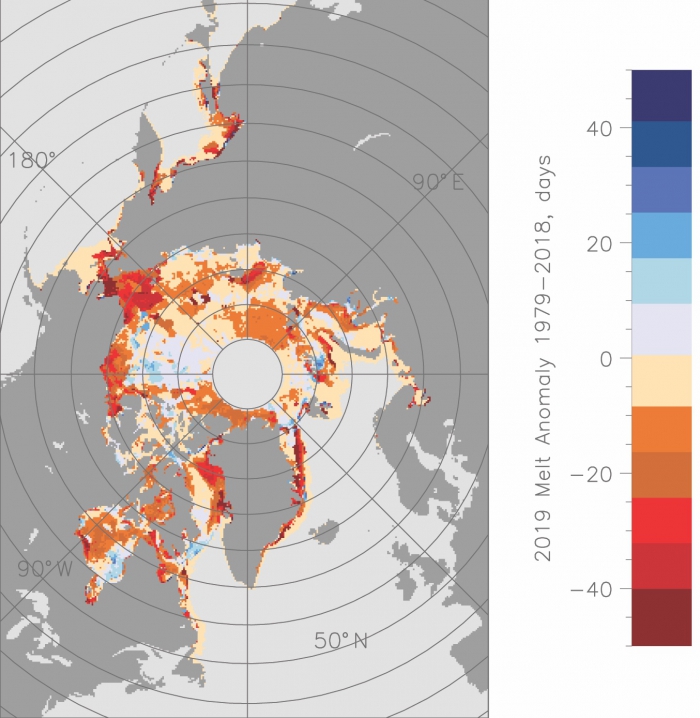
Note: further information about the passive microwave data is available on the NASA Cryosphere website
Regional Sea Ice Extent Discussions
Alaska Region
Through mid-July, the combined Chukchi and Beaufort sea-ice extent continued to be lower than in any previous year of the satellite record (Figure 6). Individually, extent in the Chukchi is lower on 16 July than in past retreat seasons, while retreat stalled in the Beaufort and extent has fluctuated around 720,000 square kilometers from mid-June through mid-July. The 16 July sea-ice extent from the passive microwave record in the Beaufort is above values recorded in 2012 and 1998 on the same date. The MASIE-based product indicates the Beaufort sea ice extent is the lowest of the past five years, although tracking close to 2016 through 12 July. The MASIE product is considered more reliable during the melt season because it is a multi-sensor product that includes the use of visible imagery and manual interpretation.
The Climate Prediction Center's current 30-day and 90-day outlooks for Alaska show a tilt towards above average temperatures over all of Alaska. Weather systems and their ocean impacts can strongly alter the trajectory of regional ice extent, as shown by the temporary reversals of ice loss in mid-June of 2019 and in both June and July of 2018 (Figure 6). While these events serve as reminders that conditions through the remainder of summer will still determine whether the Beaufort-Chukchi ice extent remains unprecedentedly low, the early retreat in 2019 favors a minimum ice extent near the low end of the historical distribution.
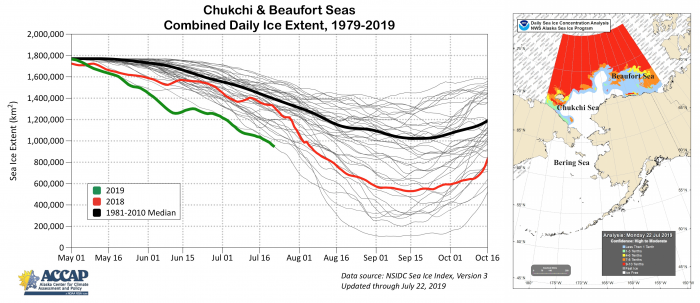
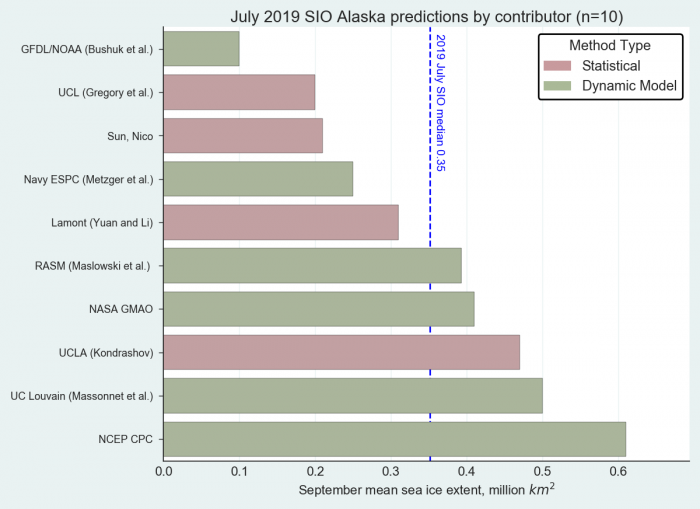
For the Alaskan regional sea-ice extent prediction, four of the ten contributions we received are based on statistical method, and six are based on dynamical models (Figure 7). Forecasts range from 0.1 million square kilometers to 0.6 million square kilometers.
Hudson Bay Region
By the third week of July, almost all ice had melted out of Hudson Bay, with just 160,000 square kilometers of ice left in the south western part of the bay, stretching from Polar Bear Provincial Park westwards and past Fort Severn. This was less than half of the amount of sea ice typically remaining about this time of year (23 July climatological average of 339,000 square kilometers). Early melt onset started, on average, five days earlier than the 1981–2010 mean for Hudson Bay, whereas the continuous melt onset period started 12 days earlier than average. Six regional outlooks were submitted for Hudson Bay for the July outlook, which ranged from no sea ice to as much as 810,000 square kilometers. Four of the forecasts, however, were for no sea ice remaining.
Antarctic Contributions
For this July report, we received six forecasts of total September Antarctic sea ice extent (one is a re-submission from the June report). There is a very large spread in the forecasts (Figure 8), and the spread is only modestly reduced from June to July. That is, new information acquired in June and July does not substantially make the forecasts more certain. The two persistence-based forecasts used as benchmarks indicate that a record low in September is a distinct possibility. At the time of this report, 2019 ties 2017 and 1986 (the second lowest and lowest on record, respectively) in terms of total sea ice extent.
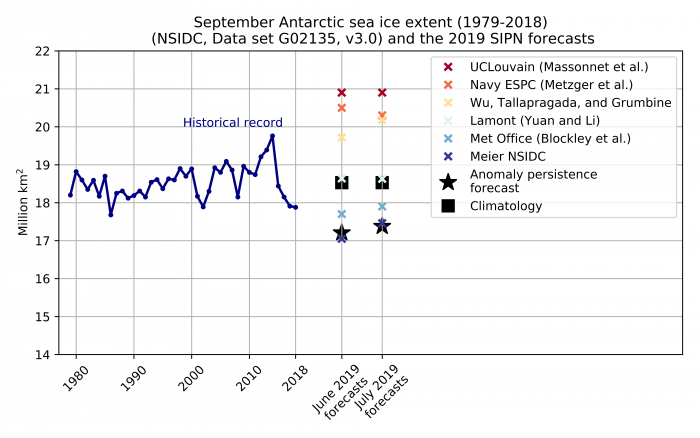
As was the case for previous years, the Sea Ice Prediction Network South will extend these analyses by coordinating a forecast for austral summer 2019–2020 and investigating the regional expression of forecast biases and uncertainties.
Contributor Key Statements, Summary of Uncertainties
![]() Summary Table of Key Statements from Individual Outlooks
Summary Table of Key Statements from Individual Outlooks
Contributor Full Report PDFs and Supplemental Material
This report was developed by the SIPN2 Leadership Team
Report Leads
Mark Serreze, National Snow and Ice Data Center (NSIDC) Director, University of Colorado Boulder, NSIDC
Walt Meier, National Snow and Ice Data Center
Julienne Stroeve, University College London, National Snow and Ice Data Center
Additional Contributors:
Rick Thoman, Alaska Center for Climate Assessment and Policy, International Arctic Research Center, University of Alaska
Molly Hardman, Cooperative Institute for Research in Environmental Sciences at the University of Colorado Boulder, NSIDC
Editors:
Betsy Turner-Bogren, ARCUS
Helen Wiggins, ARCUS
Stacey Stoudt, ARCUS
Lisa Sheffield Guy, ARCUS
Suggested Citation:
Serreze, M., Meier, W., and Stroeve, J., U.S. Bhatt, P. Bieniek, E. Blanchard-Wrigglesworth, H. Eicken, M. Hardman, L. C. Hamilton, J. Little, F. Massonnet, J.E. Overland, M. Steele, R. Thoman, J. Walsh, M. Wang, and H. V. Wiggins. Editors: Turner-Bogren, B., L. Sheffield Guy, S. Stoudt, and H. V. Wiggins. July 2019. "Sea Ice Outlook: 2019 July Report." (Published online at: https://www.arcus.org/sipn/sea-ice-outlook/2019/july.)
This Sea Ice Outlook Report is a product of the Sea Ice Prediction Network–Phase 2 (SIPN2), which is supported in part by the National Science Foundation under Grant No. OPP-1748308. Any opinions, findings, and conclusions or recommendations expressed in this material are those of the author(s) and do not necessarily reflect the views of the National Science Foundation.


