Outlook Report
Executive Summary
We express our gratitude to the groups that contributed to this 2020 August Sea Ice Outlook (SIO) report. This activity would not be possible without the dedication of the many contributors of the Pan-Arctic, Antarctic, and regional forecasts. The 2020 August Sea Ice Outlook received 39 submissions (33 in June, 38 in July). These outlook contributions are based on various methods, including dynamical (physics-based) models, statistical approaches, heuristic (qualitative), and machine-learning. Along with projections of total Arctic sea-ice extent for September, the SIO received 7 (8 in June, 7 in July) projections of Antarctic total ice extent and 10 (8 in June, 10 in July) projections of ice extent in the Alaskan sector, which combines the Bering, Chukchi, and Beaufort seas. Sea-ice probability (SIP) for 13 models and 9 first ice-free date (IFD) are included in the August 2020 SIO. New for the August SIO report, we invited contributors to submit forecasts of Ice Advance Date (IAD), using both a 15% and 80% sea-ice concentration threshold.
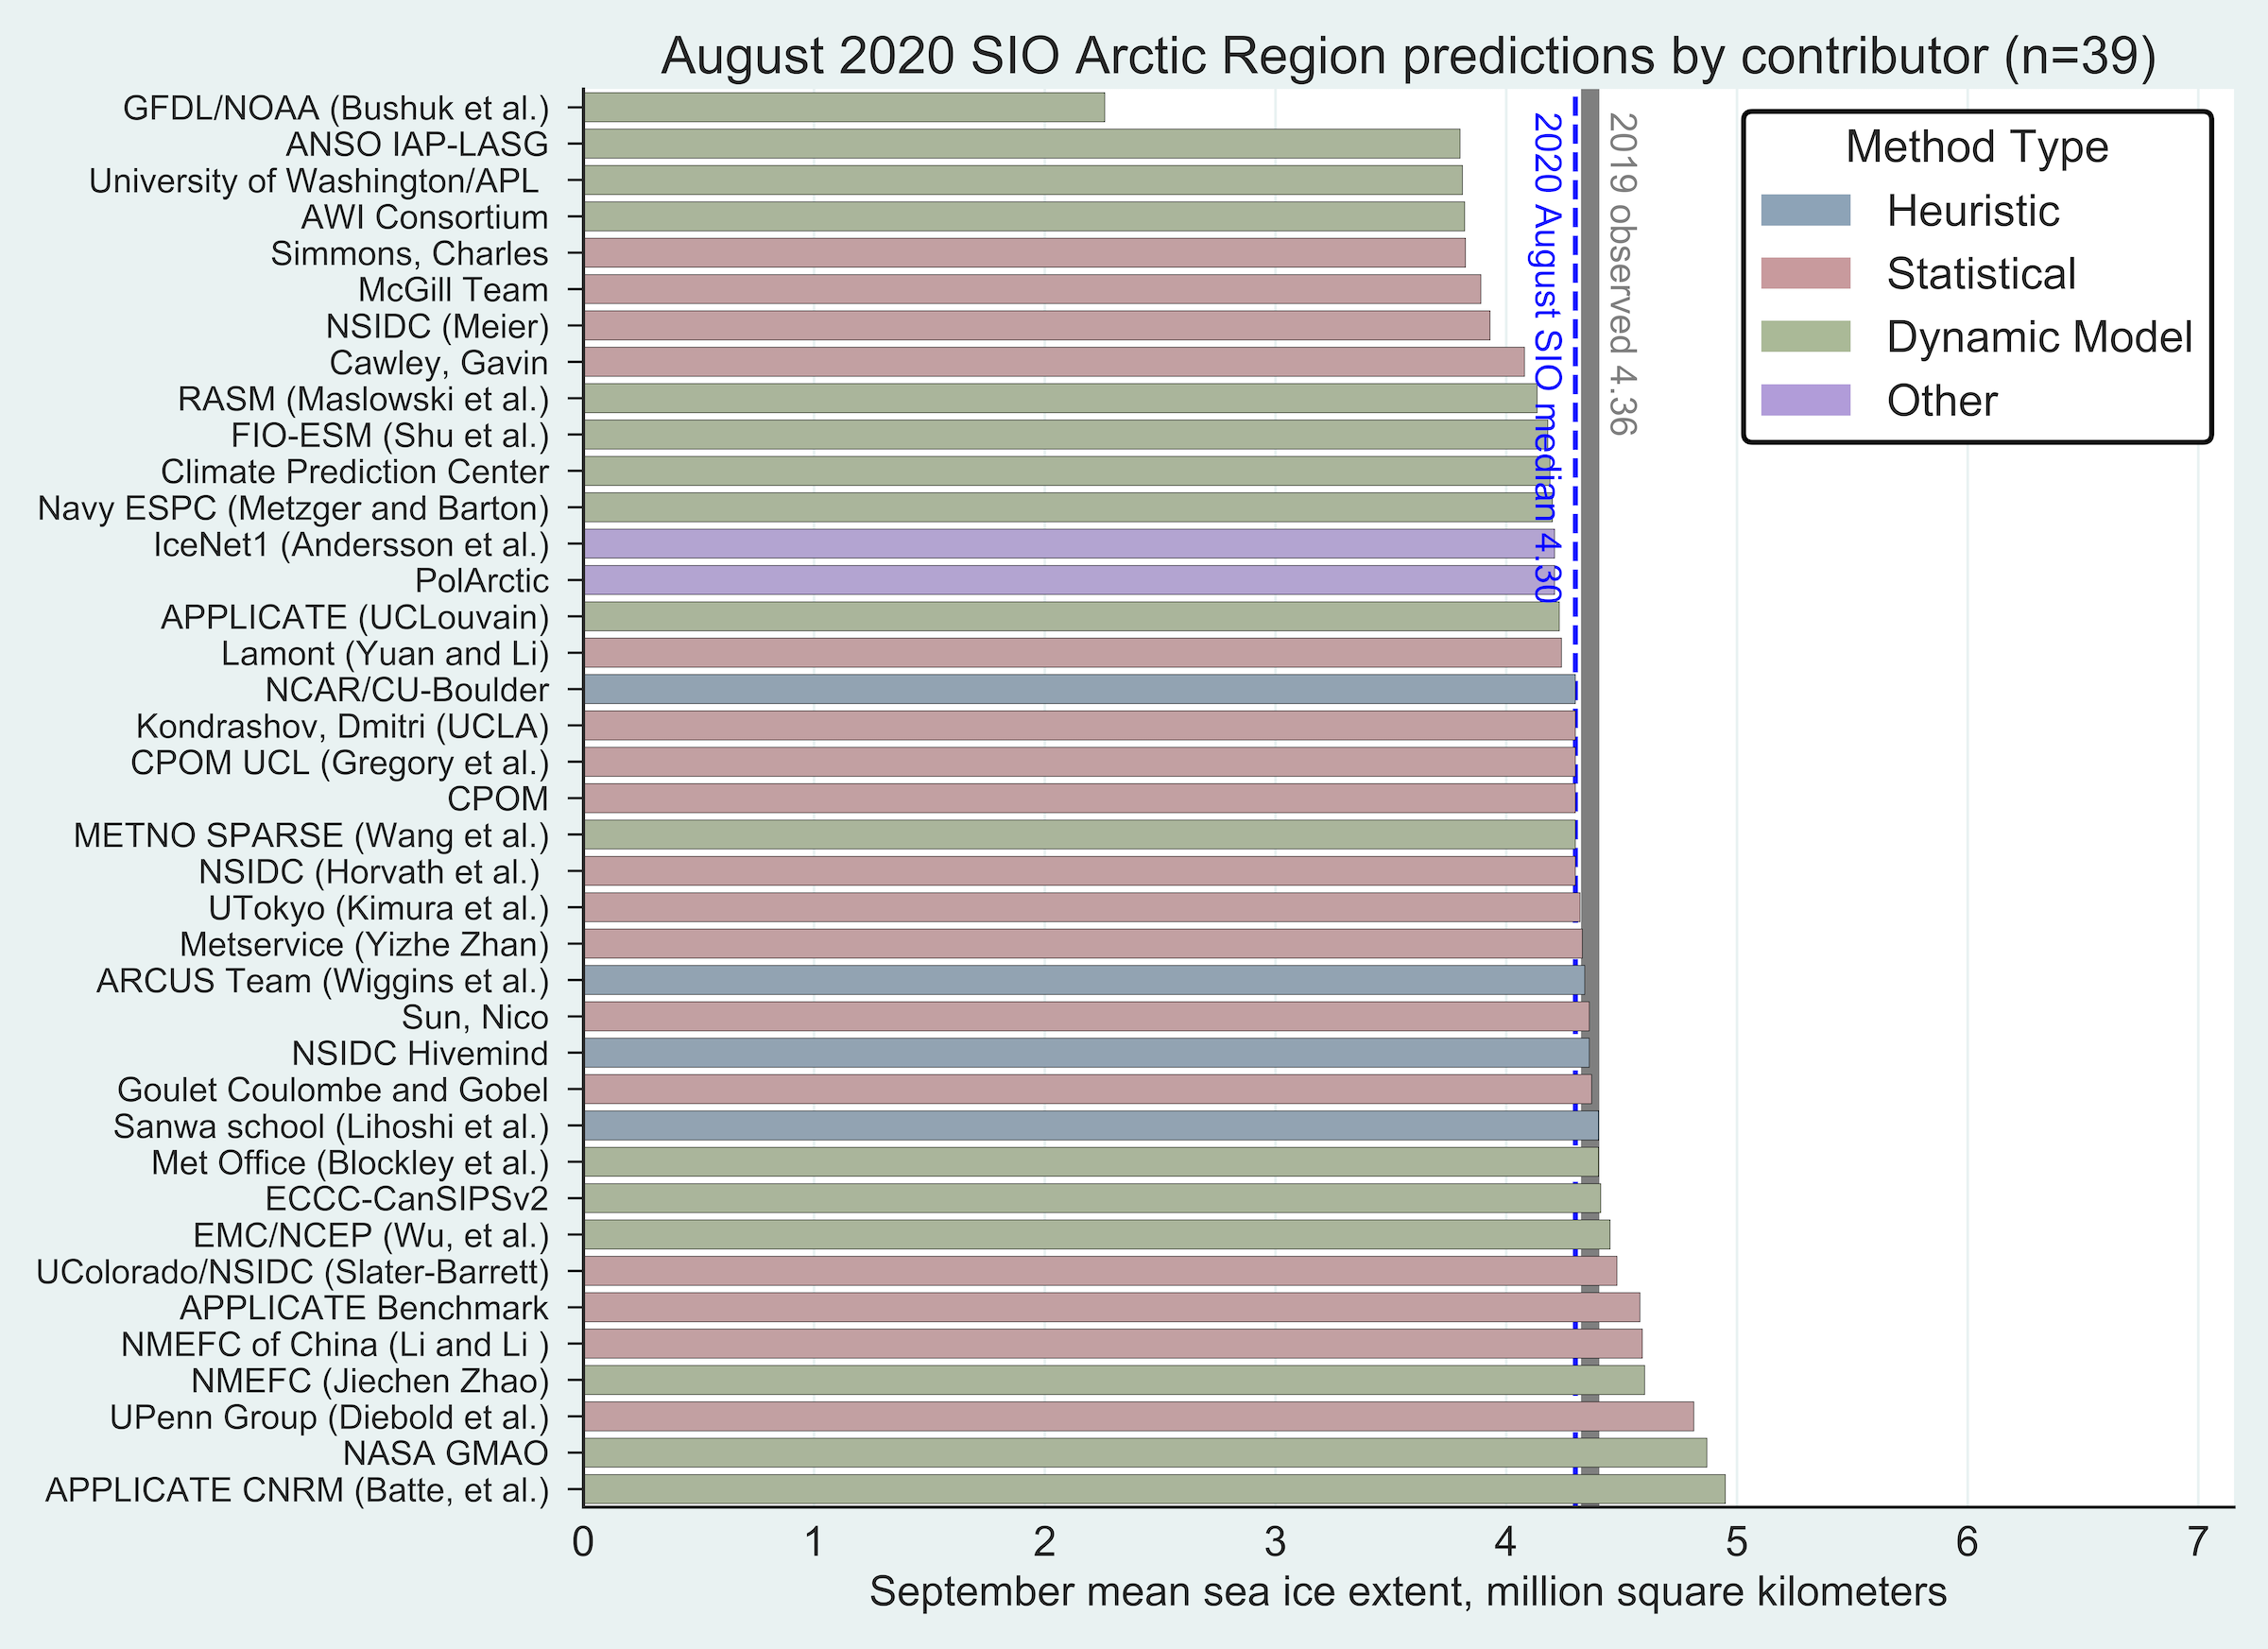
The Pan-Arctic August Outlook median forecast value for September 2020 sea-ice extent is 4.30 million square kilometers, with quartile values of 4.1 and 4.5 million square kilometers. The median of the August submissions is close to that from July (4.36 million square kilometers) and June (4.33 million square kilometers). Based on the National Snow and Ice Data Center (NSIDC) Sea Ice Index (SII), the Arctic sea-ice extent index is 4.43 million square kilometers, as of 25 August 2020. Arctic sea-ice extent in 2020 remains well below the climatological median and has closely followed the 2012 values for much of the summer. However, the forecasts continue to support that September 2020 mean sea-ice extent will not set a new record low.
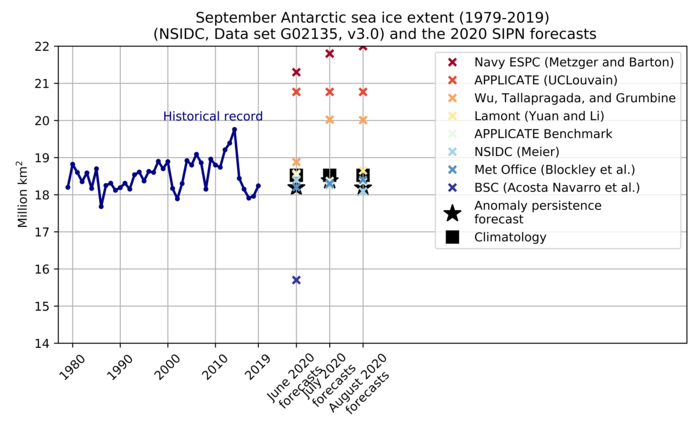
We received seven forecasts for Antarctic total September sea-ice extent and they display a large spread. The observed Antarctic extent has experienced a relatively rapid increase since the beginning of August and the extent is now above the 1981-2010 median extent for this time of year.
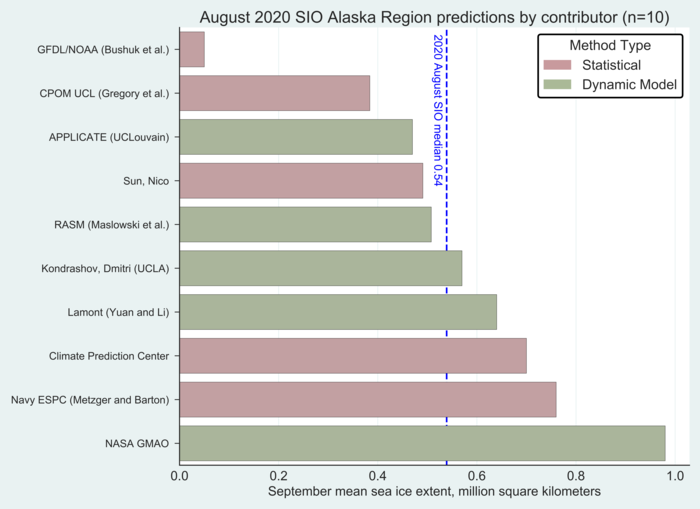
For the Alaskan regional sea-ice extent a median value of 0.5 million square kilometers was predicted from the 10 contributions based on statistical methods and dynamical models. Forecasts range from 0.05 million square kilometers to 0.98 million square kilometers, which are below the median observed value of mean September sea-ice extent in the Alaskan seas over the 1981–2010 period of 1.04 million square kilometers. Sea-ice extent observations in the Alaskan seas as of 22 August are 0.66 million square kilometers.
This August Outlook report was developed by lead author Uma Bhatt, University of Alaska Fairbanks (Executive Summary, Overview, and Discussion of Current Conditions) with contributions from Edward Blanchard-Wrigglesworth, University of Washington (Discussion of Spatial Field Predictions); Cecilia Bitz, University of Washington (spatial field figures); Michael Steele, University of Washington (Discussion of Ocean Heat); John Walsh and Richard Thoman, University of Alaska Fairbanks Discussion of Ice Conditions in the Bering and Chukchi Seas); François Massonnet, Université Catholique de Louvain (Discussion of Antarctic Contributions); Joseph Little (Discussion of User Needs); Molly Hardman, NSIDC (statistics and graphs); Betsy Turner-Bogren, Helen Wiggins, Stacey Stoudt, Lisa Sheffield Guy, and Jan Kuba Grzeda, ARCUS (report coordination and editing); and the rest of the SIPN2 Project Team.
Note: The Sea Ice Outlook provides an open process for those who are interested in Arctic sea ice to share predictions and ideas; the Outlook is not an operational forecast.
See: August Call for Contributions
Overview
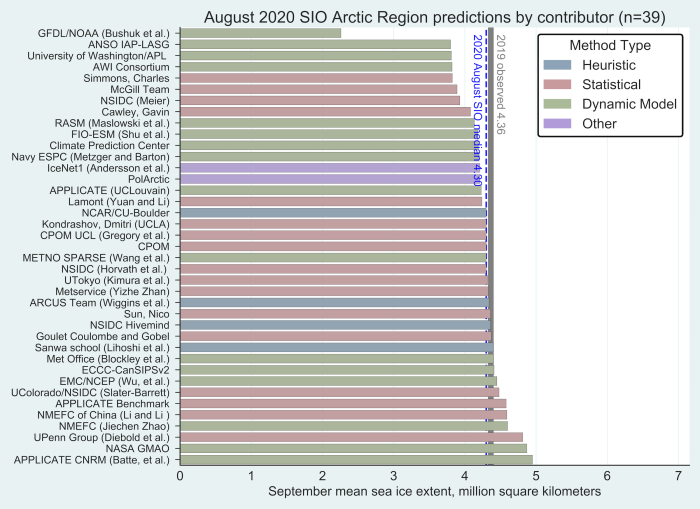
The August Outlook is based on a total of 39 forecasts (Figure 1), of which 25 are new August submissions while the remaining 14 are carried over from June and July. The median August Outlook value for the September 2020 sea-ice extent is 4.30 million square kilometers, with quartile values of 4.1 and 4.5 million square kilometers. Of the 39 August 2020 contributions, 16 are based on dynamical models, 17 are based on statistical methods, 4 are based on heuristic approaches (qualitative analyses), and 2 used machine learning-based methods. The median of the August submissions is close to that from July (4.36 million square kilometers) and June (4.33 million square kilometers). The 2020 August Outlook median is higher than 2019 (4.22 million square kilometers) and lower than 2018 (4.57 million square kilometers).
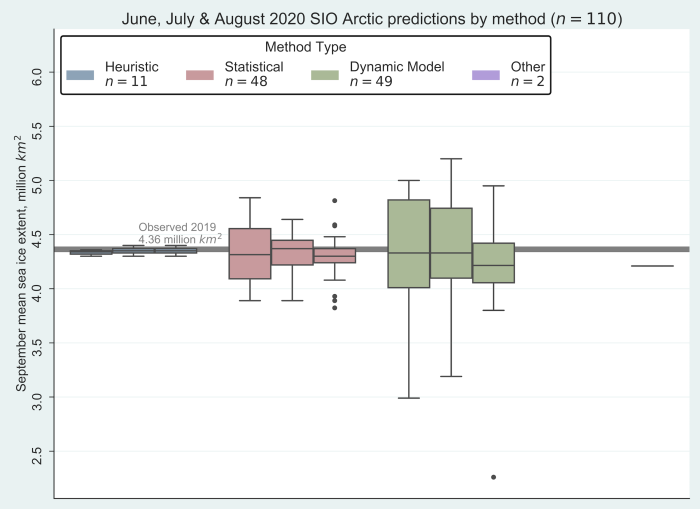
The median value is 4.30 million square kilometers for the statistical, dynamical, and heuristic forecasts in the August Outlook, while the machine learning-based median is 4.2 million square kilometers. Of the four approaches, the machine learning-based forecasts (labeled "other" in Figure 1) have the smallest quartile range of zero (both submitted 4.2 million square kilometers), followed by heuristic forecasts that have a quartile range of 4.3 to 4.4 million square kilometers. The corresponding ranges are 4.0 to 4.6 million square kilometers for the dynamical model forecasts and 4.1 to 4.5 million square kilometers for the statistical forecasts. As shown in Figure 2, the quartile ranges of the statistical and dynamical model forecasts issued in August are substantially smaller than the corresponding ranges of the July forecasts, pointing to a reduction of the uncertainties within each source. This was also the case in the 2019 August Outlook. The quartile range for heuristic models was much smaller in August 2020 than it was in August 2019.
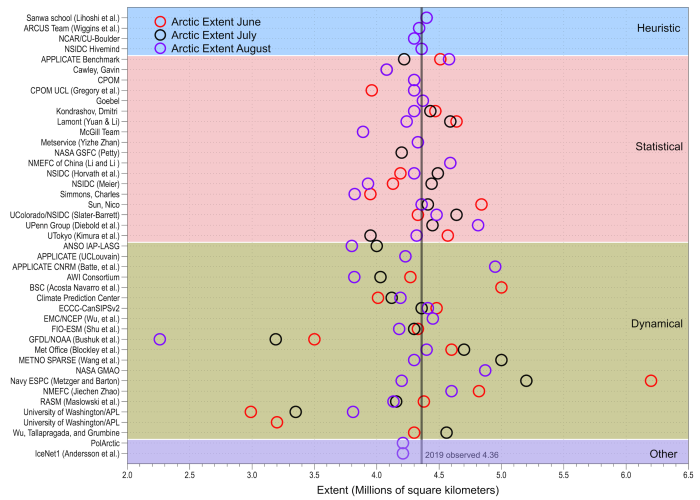
Figure 3 compiles each group's submissions for June to August with the 2019 mean September Arctic ice extent shown for reference. Dynamical models provided the season's lowest (2.26 million square kilometers in August) as well as highest (6.2 million square kilometers in June) September mean sea-ice extent forecasts. Similar to past Outlooks, individual group submissions vary more between June through August for dynamical forecasts compared to the other methods. Standard deviations were calculated for each group that submitted forecasts for all the months and then were averaged based on method type. The averaged standard deviation was 0.28 for dynamical forecasts and 0.18 for statistical forecasts.
Note: Click the image to view a larger version of Figure 1
Note: Click the image to view a larger version of Figure 2
Note: Click the image to view a larger version of Figure 3
Discussion of Spatial Field Predictions
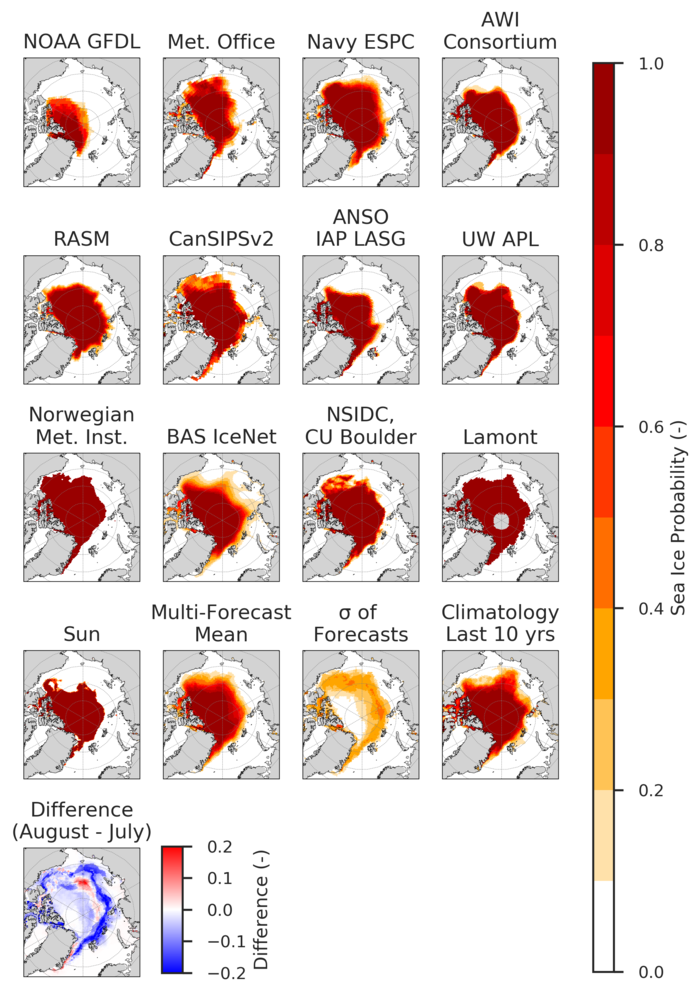
Below we show and discuss forecasts of September sea-ice probability (SIP) and first ice-free date (IFD). New for the August 2020 SIO, we invited contributors to submit forecasts of Ice Advance Date (IAD), using both a 15% and 80% sea-ice concentration threshold (see Metrics for the Sea Ice Outlook for detailed description of metrics). Additionally, SIPN2 is now computing SIP, IFD, and IAD from forecasts of sea-ice concentration (SIC) submitted directly by contributors, and we encourage all groups to submit full-field SIC forecasts whenever possible. We do not bias-correct any fields.
SIP is defined as the fraction of ensemble forecasts that forecast September ice concentration in excess of 15% (for example, if just four out of eight ensemble forecasts predict in excess of 15% sea ice, the SIP is 50%). IFD is the first date in the melt season at which the ice concentration at a given location first drops below a certain threshold—this year we provide forecasts of IFDs for two thresholds, 15% and 80% sea-ice concentration. There are 13 forecasts of SIP (9 dynamical, 4 statistical) (see Figure 4), 9 forecasts of IFD at 15% (7 dynamical, 2 statistical) (see Figure 5), and 8 forecasts of IFD at 80% (7 dynamical, 1 statistical) (see Figure 6).
Sea Ice Probability (SIP)
SIP forecasts are lower than last month, probably due to the large melting and warm conditions in July. It is especially striking right at the sea-ice edge. Multi-model forecast uncertainty, as quantified by the standard deviation across models, is also lower, indicating that forecasts agree with each other more than in July. The multi-model ensemble (the average forecast across all contributions) is below the climatology of the last 10 years.
First Ice-Free Date (IFD)
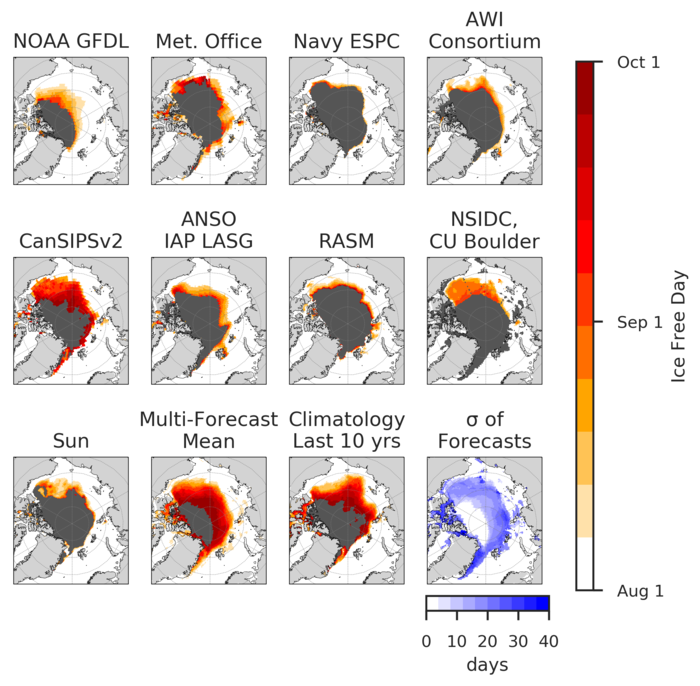
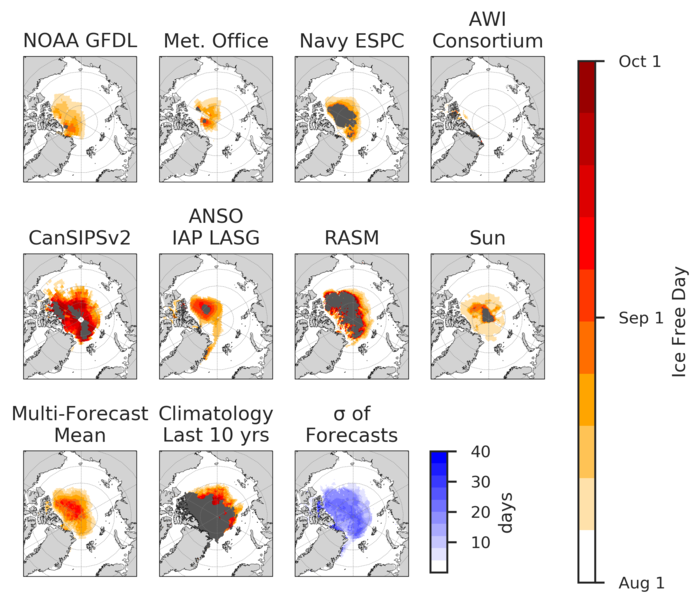
Some models show melting conditions along the marginal ice zone well into September (e.g., CanSIPSv2), whereas others end the melt season a month earlier, with latest ice-free days in late August (e.g., NOAA GFDL). This is an indication of how forecasts have difficulty identifying the September minimum and the timing of ice retreat. It is also interesting to note the range of forecasts of IFD80 in the central ice pack: here some models forecast sea-ice concentration over 80% for the whole period (e.g., RASM), whereas others forecast sea-ice concentration below 80% everywhere (e.g., NOAA GFDL).
Forecasted Ice-Advance Dates
We have received two forecasts of IAD, and produced two other IAD forecasts using forecasts of daily sea-ice concentration. Figure 7 shows the IADs for all four contributors.
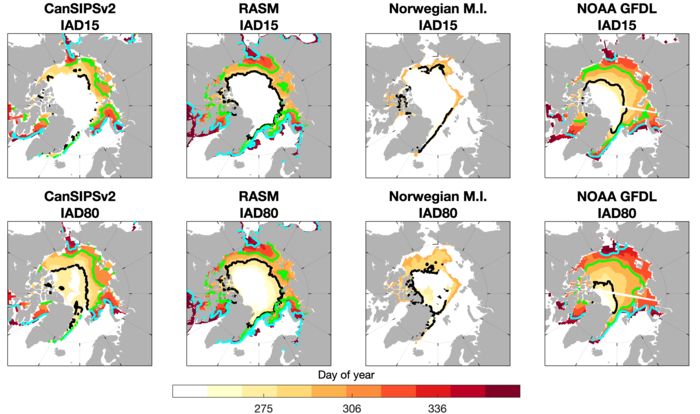
In general, models that forecast lower September sea-ice conditions also forecast later ice advance dates (e.g., NOAA GFDL). The Northeast Passage is forecast to remain open (at less than 80% SIC) until early November by NOAA GFDL and CanSIPSv2, but is forecast to freeze up by mid-late October by RASM.
Forecast Initial Conditions
As in June and July, we continue to invite contributors to submit their forecast initial conditions (ICs, for sea-ice concentration and sea-ice thickness) to better understand how observations are being used in forecasts and investigate the relationship between initial conditions and forecasts. For the August 2020 SIO, we received five submissions of ICs from dynamical models (RASM, Navy ESPC, NOAA GFDL, AWI, and CanSIPSv2), shown in Figure 8. CanSIPSv2 is a two-model forecast system, and we show the ICs used by both individual models.
Figure 8 shows how models tend to agree in their initial conditions of sea-ice concentration, but show a very large spread in sea-ice thickness, from sea-ice less than one meter thick (e.g., NOAA GFDL) to thicknesses of 2–3 meters in other initial conditions. In general, models agree in the pattern of thicker ice north of Greenland and the Canadian Arctic Archipelago. We note that NOAA GFDL shows the smallest extent forecast in Figure 1. In the post-season report, we will present analysis of the relationship between initial conditions, SIO forecasts, and comparisons to observations. Other groups are invited to submit their 2020 SIO ICs via the SIPN Data Portalbefore 31 October.
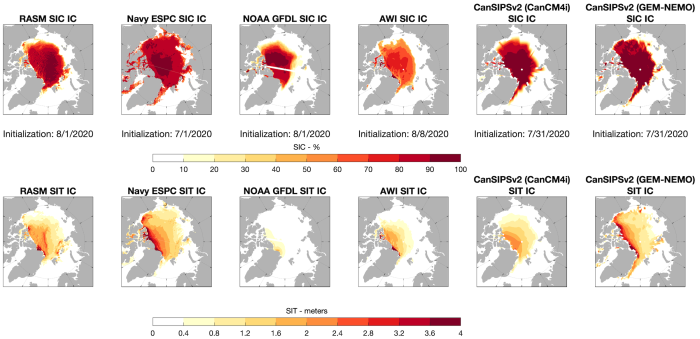
Note: Click the image to view a larger version of Figure 8.
Discussion of Supplemental Materials and Methods
For the August 2020 SIO, 13 groups submitted supplemental materials (see: Contributor Full Reports and Supplemental Materials below). The supplemental material contents vary among the contributions. They include information about: methodology on calculations and bias-corrections, ensemble spread and statistics, statistical model description, range of forecasts, uncertainties, and postprocessing.
Discussion of Current Conditions
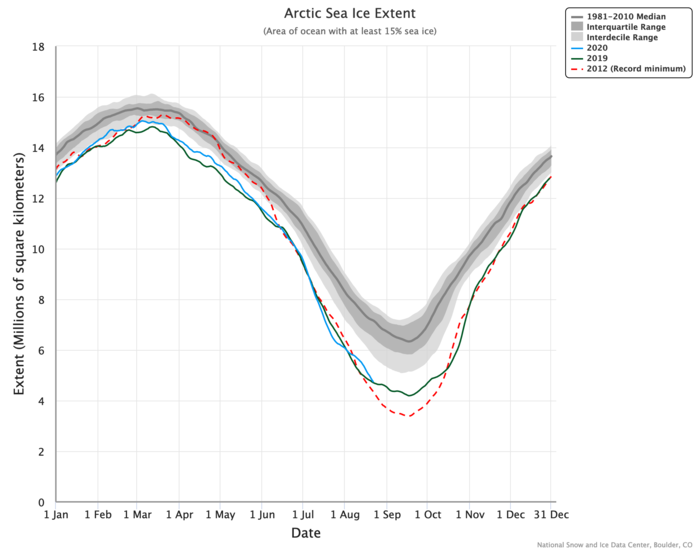
As of 25 August 2020, the Arctic sea-ice extent index is 4.43 million square kilometers. Arctic sea-ice extent in 2020 remains well below the climatological median and has closely followed the 2012 values for much of the summer (Figure 9). However, the forecasts continue to support that September 2020 mean sea-ice extent will not set a new record low. The July and August Arctic sea-ice extent has followed the sea-ice extent of 2019 but the rate of change has been more variable in 2020 than it was in 2019. If the current retreat rate continues then there is a good chance that 2020 could displace 2019 as third-lowest (4.36 million square kilometers) or 2007 for second-lowest (4.27 square kilometers) mean September sea-ice extent.
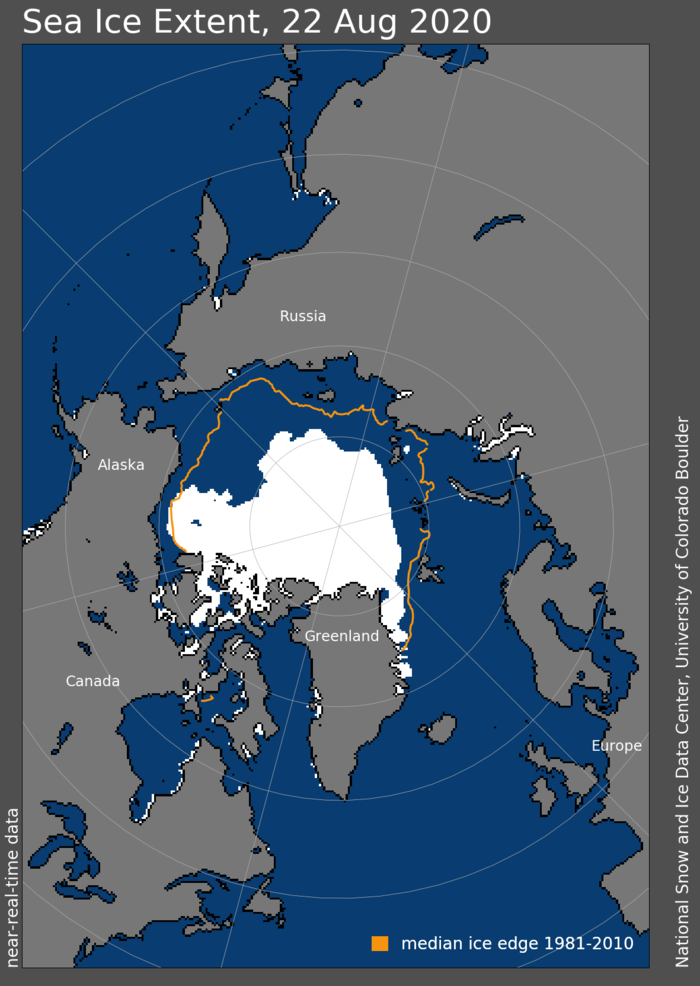
Between July and August 2020 (Figure 10), the greatest retreat of Arctic sea-ice occurred in the Beaufort, Chukchi, and East Siberian seas. Sea ice is close to the long-term median only in the Beaufort Sea and greatly receded in the Chukchi and Eurasian seas from the long-term median. Ranking of the Arctic seas for daily sea-ice extent on 20 August 2020 shows that the Beaufort is close to the middle while the Chukchi Sea, Baffin Bay, the Arctic Ocean, and the Eurasian Seas all rank in the top five for lowest regional sea-ice extent.
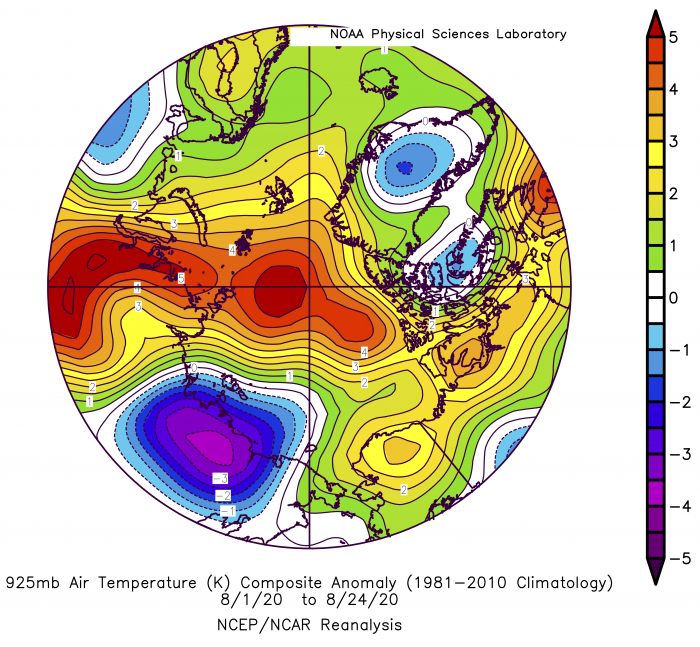
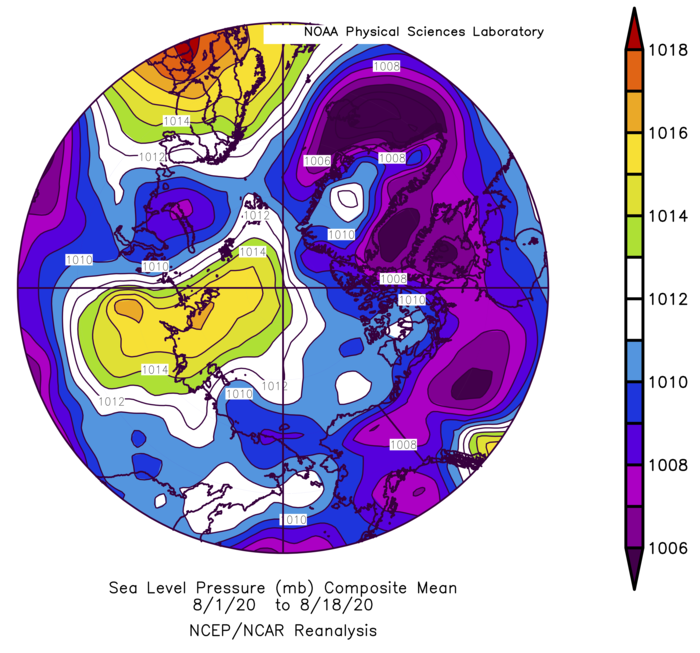
The area of positive 925 hPa air temperature anomalies over the Arctic has contracted since July and is prominent over the Atlantic Arctic (Figure 11) with anomalies between 4–6˚C. Temperatures are below normal around the East Siberian Sea and near normal in the Chukchi and Beaufort seas. The anticyclone (Figure 12) that was present in July over the Arctic Ocean has decreased in size and shifted towards central Siberia and coincides with the positive temperature anomalies. The western Arctic from Greenland to Alaska is characterized by low pressures during the first three weeks of August. The NOAA CFSv2 (Figure 18) and CanSIPS (Figure 19) September forecasts both predict slightly lower than normal sea-level pressure.
Discussion of Ocean Heat
Sea surface temperature (SST) in the Beaufort Sea follows the typical spatial pattern in August 2020, i.e., warmest in the eastern Beaufort and to the west in the northern Chukchi Sea, and coolest north of Alaska in the western Beaufort (Figure 13). However, what is somewhat unusual is that the extent of open water and thus of ocean warming in the eastern Beaufort is constrained toward the continental shelves, so that much of the deep basin is still filled with sea ice. However, ice concentration is rapidly falling in this area (i.e., the southeastern Beaufort Sea) and thus is vulnerable to a potential storm that could mix this decaying ice with nearby warm ocean waters; a vast area of open water might then result. However, this is merely speculation, and it is equally likely to simply freeze over again in a few weeks after the ice extent minimum. Meanwhile, the ice edge has moved rapidly northward in the western Beaufort, exposing a large open water area that nonetheless has not warmed dramatically, owing to the late date of retreat. In fact, a band of cold SSTs is clearly visible to the south of the ice edge from western Beaufort longitudes westward all the way to Fram Strait. At this late date in the summer, further ice retreat is generally forced by heat accumulated and stored in the ocean over the summer, given that the net air-sea heat flux is generally approaching zero or even turning upward (i.e., atmosphere cooling the ocean). Thus, it is most likely that further sea-ice retreat will be minimal within the Arctic Ocean (except possibly in the eastern Beaufort, as described above).
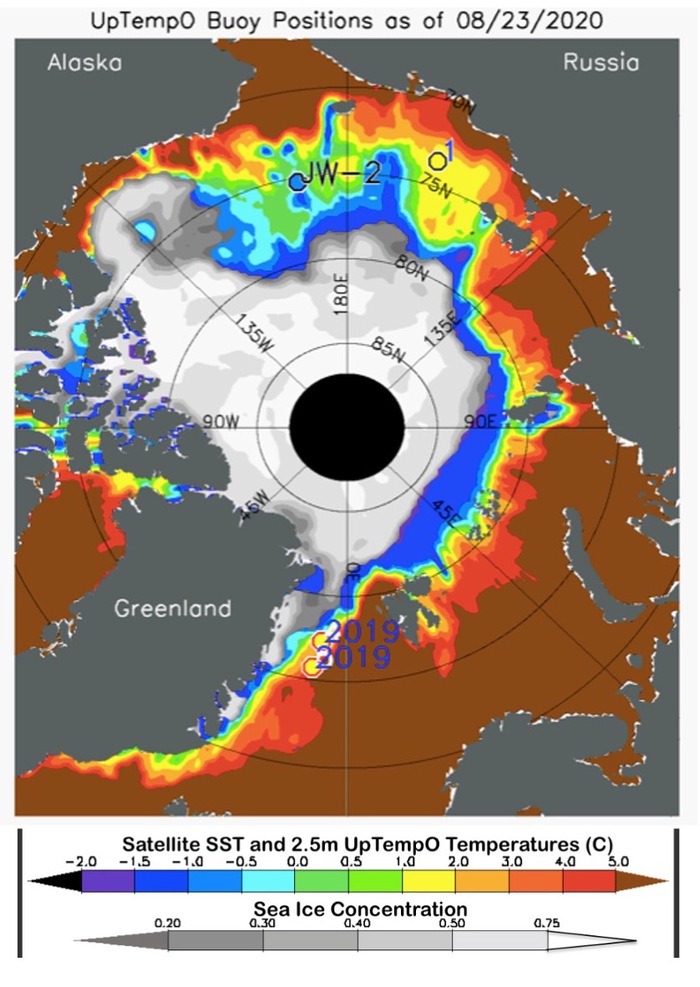
Note: Figure 13 is sourced from NOAA dOISST and NSIDC NRT passive microwave. Data for UpTempO drifting buoys locations is available for downloading from the UpTempO buoy website.
Regional Sea-Ice Extent Discussion
Alaska Region
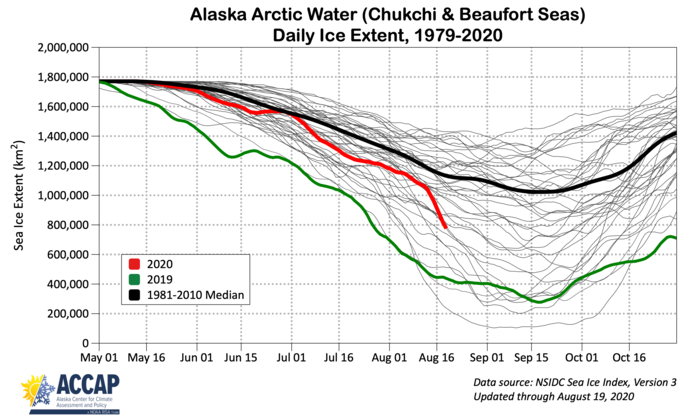
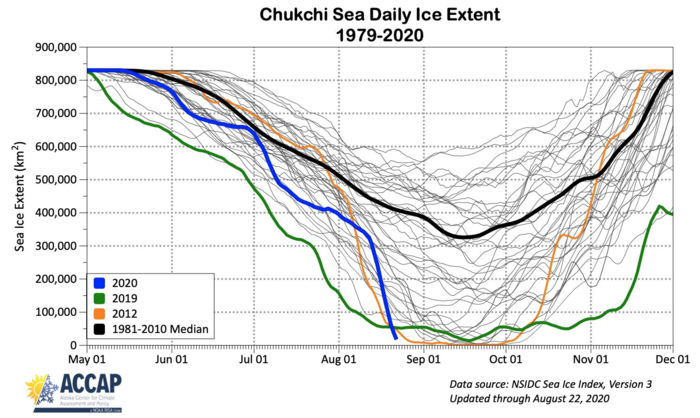
Since the July Outlook, sea ice in the Beaufort Sea has retreated from the north coast of Alaska (Figure 14) and the combined Chukchi and Beaufort sea region sea-ice extent continued to retreat at an increased rate in August (Figure 15). The 22 August sea-ice extent in the Beaufort Sea was 0.64 million square kilometers, which is only slightly lower than 1981–2010 median value of 0.74 million square kilometers. The 22 August 2020 sea-ice extent in the Chukchi Sea was 0.17 million square kilometers, which is lower than the 1981–2010 median of 0.40 million square kilometers. The sea-ice extent in the Chukchi sea (Figure 16) accounts for the sharp decline in Figure 15 and is now the lowest for the date and lowest this early in the late summer. The increased rate of retreat in August is thought to be caused by an end-of-July storm that was the strongest of storms over the Arctic Ocean since 2012 (R. Thoman personal communication). In the Beaufort Sea, average 925 hPa winds were from the northeast along the North Slope of Alaska, which helped to maintain sea ice in the area. These winds maintained their direction, but weakened substantially during the first half of August to less than 2–3 m/s from 3–7 m/s; this likely influenced sea-ice retreat at this time. Currently, coastal Beaufort Sea surface temperatures from the Mackenzie River eastward are 3–4˚C warmer than normal. Overall Beaufort sea-ice extent on 22 August is about double that found in 2019 at this time.
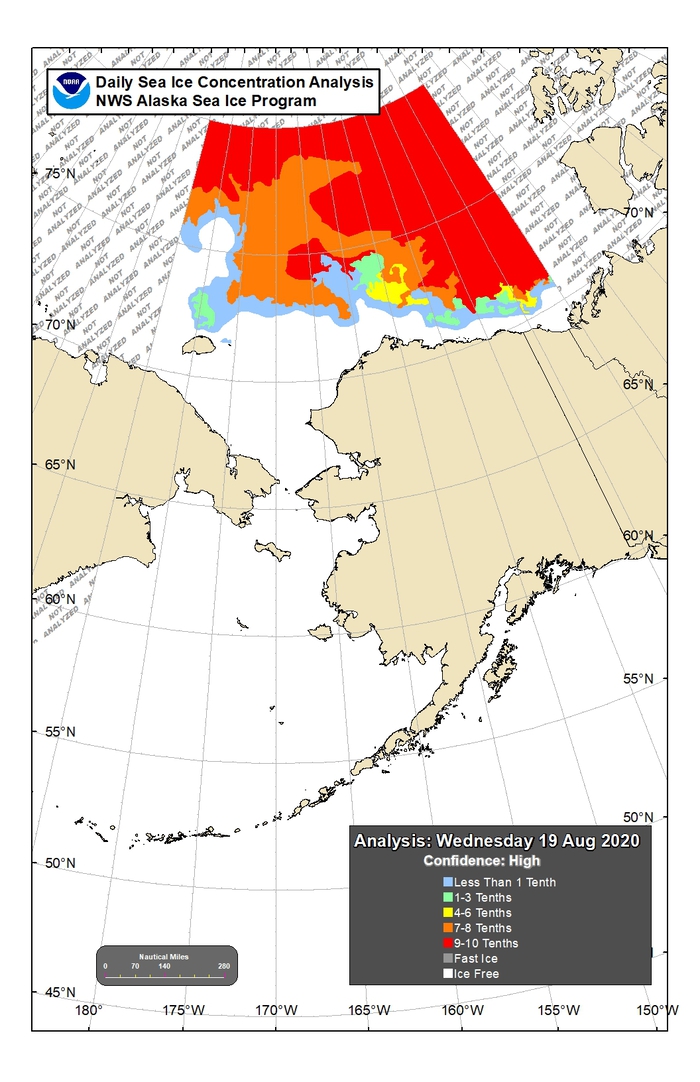
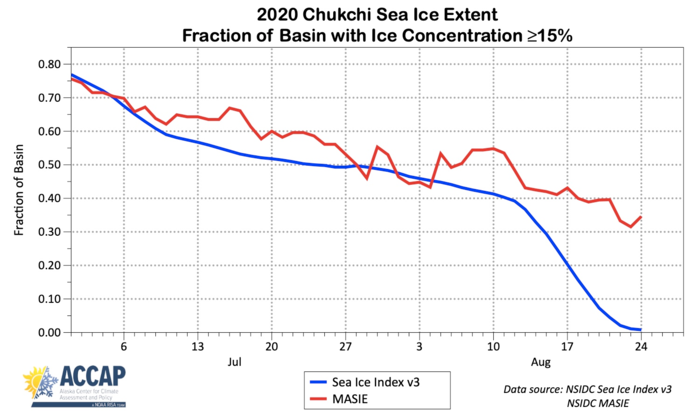
In Figure 17, two methods for monitoring sea ice are compared and the Sea Ice Index V3 and MASIE display differences. It is not surprising that these two analyses differ at this time of year and it does not mean either product is "wrong" as they are consistent in their respective methodologies. The passive microwave sensors are affected by surface water, so heavily melting small thin floes in the Chukchi tend to be undercounted. MASIE can use visual imagery interpretation, and perhaps synthetic-aperture radar (SAR), to detect the presence of ice, so it better captures such areas. On the other hand, MASIE analyses may be subject to data availability (e.g., clouds in visible imagery) and analyst subjectivity, so it may be somewhat conservative. By September, the thin floes eventually melt and the two methods generally come into close agreement by the minimum. Generally, MASIE tends to be 1–2 weeks behind the passive microwave.
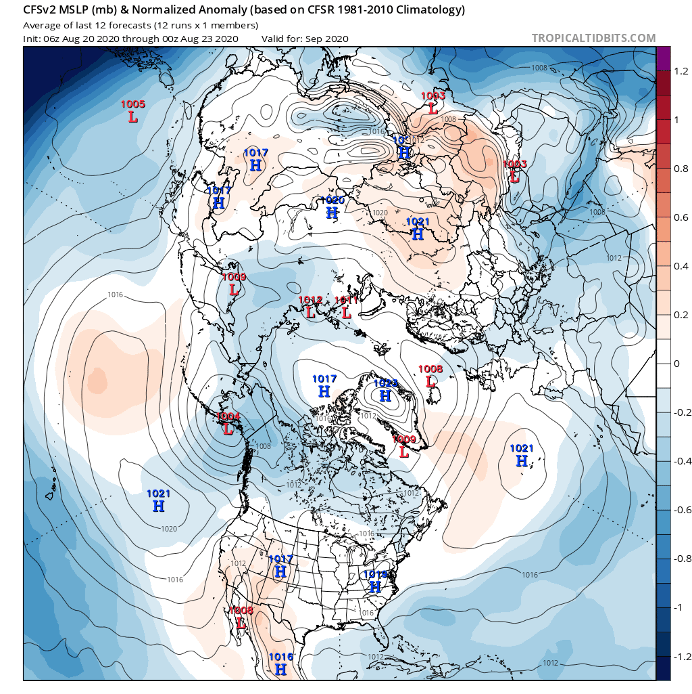
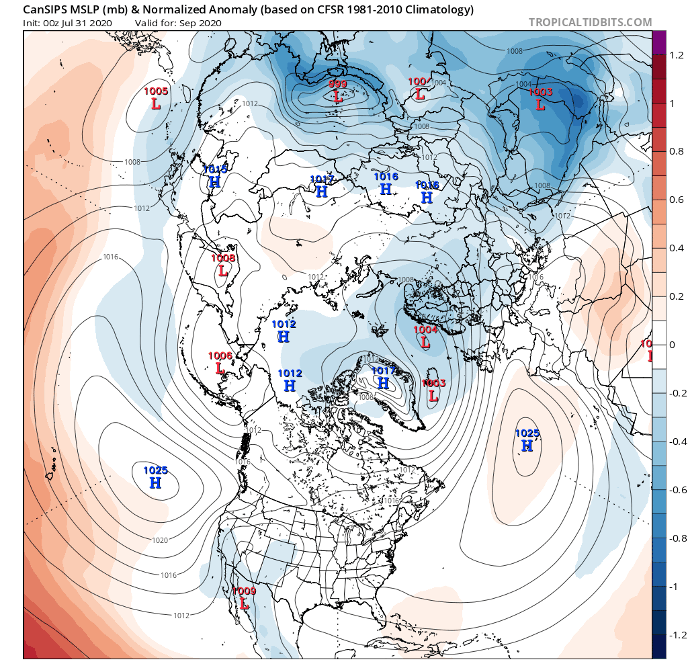
The Climate Prediction Center's (CPC's) outlook for September contains a greater than 60% likelihood that temperatures will be significantly above normal (i.e., in warmest third) along the entire northern and western coasts of Alaska. However, these forecasts of surface air temperature are strongly influenced by recent decadal trends and by the current state of sea ice and ocean surface temperatures. The Chukchi Sea's abnormally low sea-ice extent—by historical standards—was almost certainly a factor in the CPC's outlook. By contrast, recent runs of NOAA's Coupled Forecast System version 2 (CFSv2) model predict below-normal temperatures at 850 mb over the Chukchi-Bering seas and near-normal temperatures over the Beaufort Sea. The 850 mb temperatures are more responsive to the atmospheric circulation, which is forecast to have below-normal sea-level pressures in the northern Alaska coastal waters (Figure 18). For the September mean, the GFS model forecasts a center of low pressure over the southern Alaska coast and a center of high pressure northeast of the Beaufort Sea, which is a pattern consistent with cool temperatures in the Chukchi-Bering sector. However, the pressure anomalies are generally weak. For comparison, Figure 19 shows the September sea-level pressure forecast from the Canadian model (CanSIPS). The CanSIPS model predicts a very flat pressure field (i.e., no strong gradients) over the Beaufort-Chukchi-Bering region, with no significant departure from normal. In aggregate, these forecasts provide no indication that the anomalies of the atmospheric circulation should be a major factor in the evolution of sea ice in Alaska waters during September.
For the Alaskan region, the median sea-ice extent prediction was 0.5 million square kilometers based on a total of 10 contributions. Five of the contributions are based on statistical methods, and five are based on dynamical models (Figure 20). Forecasts range from 0.05 million square kilometers to 0.98 million square kilometers, which are below the median observed values of mean September sea-ice extent in the Alaskan seas over the 1981–2010 period of 1.04 million square kilometers.
Note: See further information at Tropical Tidbits.
Note: See further information at Tropical Tidbits.
Discussion of Antarctic Contributions
For this August report, we received seven forecasts of total September Antarctic sea-ice extent (two are re-submissions from the July report). One June submission (BSC) was not resubmitted, and was the one projecting the lowest September extent. There is a very large spread in the forecasts (Figure 21), and the spread is unchanged, if not larger, in August compared to July. We note that the three most extreme outlooks are generated using dynamical models. The observed Antarctic extent has experienced a relatively rapid increase since the beginning of August and the extent is now above the 1981–2010 median extent for this time of year. This is the first the extent has been substantially above the median since August 2016.
Discussion of User Needs
Along with assessing the needs of end-users, SIPN2 is also seeking to engage SIO contributors in order to assess the value of the SIO and identify how our network can support research needs. We will be conducting a survey of SIO contributors in late September. Information from this survey will be used to identify how contributors utilize the SIO, how the SIO might contribute to their research, and where improvements in the SIO might be made.
Contributor Key Statements, Summary of Uncertainties
![]() Summary Table of Key Statements from Individual Outlooks (PDF 218 KB)
Summary Table of Key Statements from Individual Outlooks (PDF 218 KB)
Contributor Full Report PDFs and Supplemental Material
This report was developed by the SIPN2 Leadership Team.
Report Lead:
Uma Bhatt, University of Alaska Fairbanks, Geophysical Institute
Additional Contributors:
Richard Thoman, Alaska Center for Climate Assessment and Policy, International Arctic Research Center, University of Alaska
Molly Hardman, Cooperative Institute for Research in Environmental Sciences at the University of Colorado Boulder, NSIDC
Editors:
Betsy Turner-Bogren, ARCUS
Helen Wiggins, ARCUS
Stacey Stoudt, ARCUS
Lisa Sheffield Guy, ARCUS
Jan Kuba Grzeda, ARCUS
Suggested Citation
Bhatt, U.S., P. Bieniek, E. Blanchard-Wrigglesworth, H. Eicken, M. Hardman, L. C. Hamilton, J. Little, F. Massonnet, W. Meier, J.E. Overland, M. Serreze, M. Steele, J. Stroeve, R. Thoman, J. Walsh, and M. Wang. Editors: Turner-Bogren, B., L. Sheffield Guy, S. Stoudt, J. K. Grzeda, and H. V. Wiggins. August 2020. "Sea Ice Outlook: 2020 August Report." (Published online at: https://www.arcus.org/sipn/sea-ice-outlook/2020/august.)
This Sea Ice Outlook Report is a product of the Sea Ice Prediction Network–Phase 2 (SIPN2), which is supported in part by the National Science Foundation under Grant No. OPP-1748308. Any opinions, findings, and conclusions or recommendations expressed in this material are those of the author(s) and do not necessarily reflect the views of the National Science Foundation.


